Open Access
Fig. 4.
Download original image
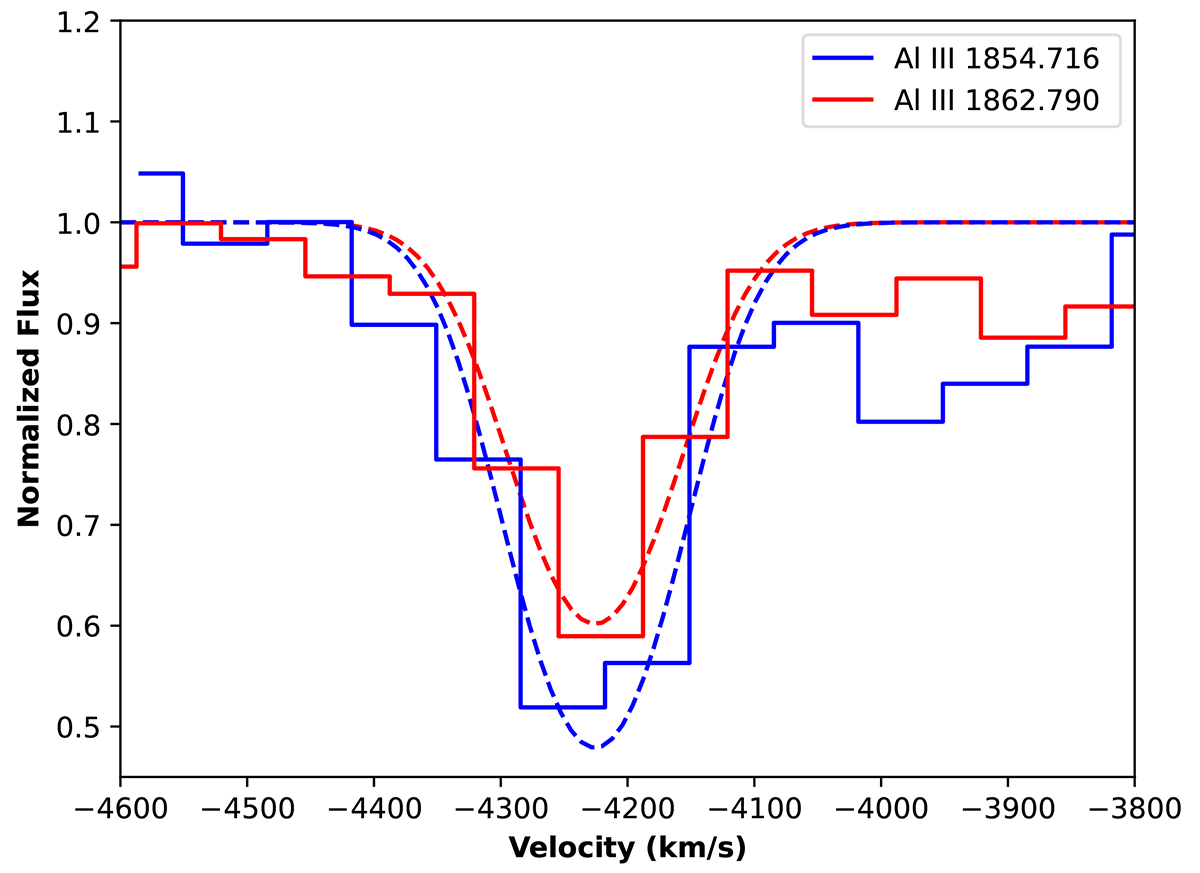
Gaussian modeling of the Al IIIλ1854.72 Å (blue) and the Al IIIλ1862.79 (red) absorption troughs. In both cases, the data are shown in histograms while the fits are shown with dashed lines of the same color.
Current usage metrics show cumulative count of Article Views (full-text article views including HTML views, PDF and ePub downloads, according to the available data) and Abstracts Views on Vision4Press platform.
Data correspond to usage on the plateform after 2015. The current usage metrics is available 48-96 hours after online publication and is updated daily on week days.
Initial download of the metrics may take a while.