Open Access
Fig. 3.
Download original image
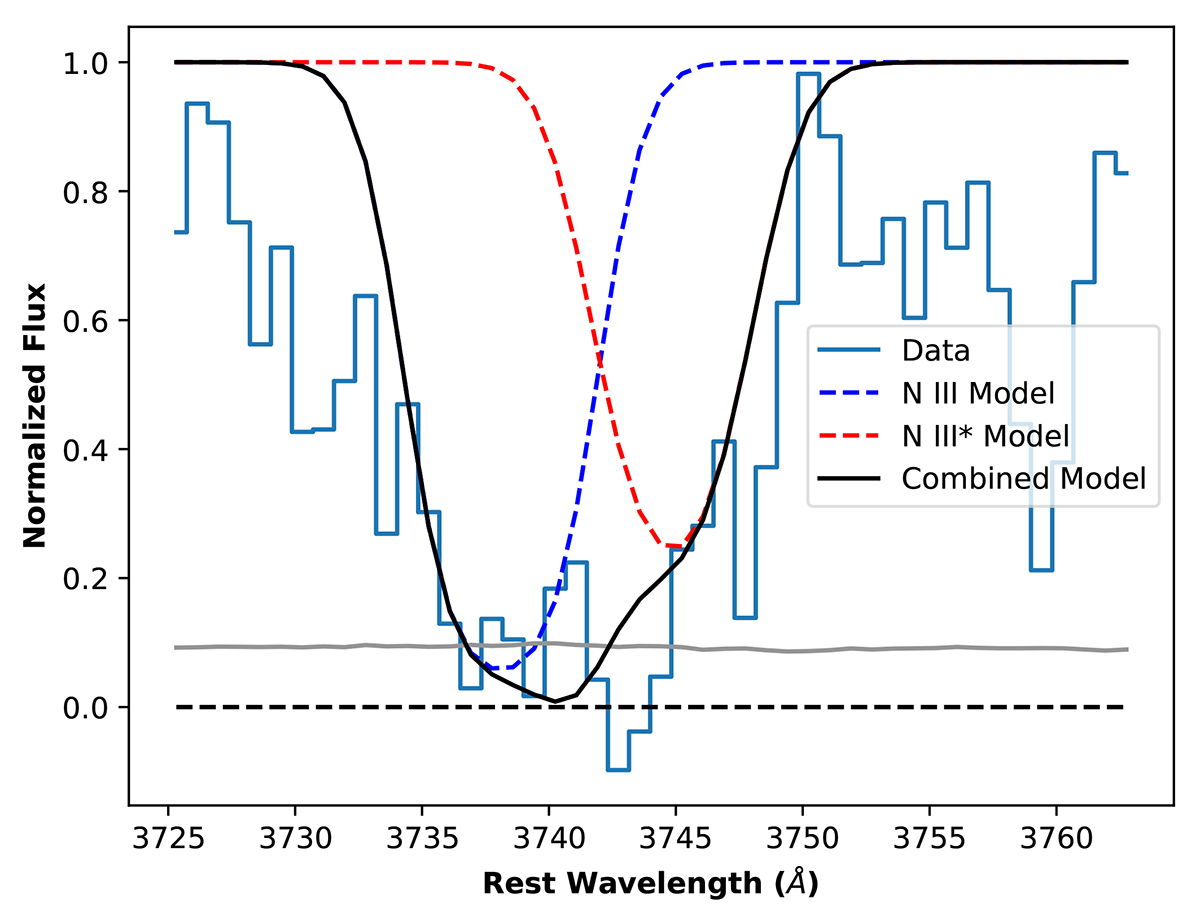
Gaussian modeling of the NIII*λ991.58 Å (blue dashed line) and N IIIλ989.80 Å (red dashed line) absorption troughs. The black solid line shows the final model, which results from combining two Gaussian curves. The grey line shows the level of noise around the modeled region.
Current usage metrics show cumulative count of Article Views (full-text article views including HTML views, PDF and ePub downloads, according to the available data) and Abstracts Views on Vision4Press platform.
Data correspond to usage on the plateform after 2015. The current usage metrics is available 48-96 hours after online publication and is updated daily on week days.
Initial download of the metrics may take a while.