| Issue |
A&A
Volume 695, March 2025
|
|
|---|---|---|
| Article Number | L19 | |
| Number of page(s) | 5 | |
| Section | Letters to the Editor | |
| DOI | https://doi.org/10.1051/0004-6361/202453324 | |
| Published online | 21 March 2025 | |
Letter to the Editor
The star grinder in the Galactic centre
Uncovering the highly compact central stellar-mass black hole cluster
1
Charles University, Faculty of Mathematics and Physics, Astronomical Institute, V Holešovičkách 2, CZ-18000 Prague, Czech Republic
2
Helmholtz-Institut für Strahlen- und Kernphysik, University of Bonn, Nussallee 14-16, D-53115 Bonn, Germany
⋆ Corresponding author; This email address is being protected from spambots. You need JavaScript enabled to view it.
Received:
6
December
2024
Accepted:
26
February
2025
Abstract
Context. Various past theoretical considerations and observational efforts suggest the presence of a population of stellar-mass black holes in the innermost parsec of the Galactic centre.
Aims. In this Letter, we investigate the impact of these black holes on the composition of the embedding stellar population through their direct collisions with the individual stars. Based on the estimated collision rates, we derive an order of magnitude radial density profile of the black hole cluster.
Methods. The estimates were obtained analytically, considering various possible formation channels for the black holes and the observed present-day properties of the stellar populations in the Galactic centre.
Results. We find that the collisions of the stars and the black holes can lead to the depletion of the most massive stars within the S-cluster on a timescale of a few million years. The necessary black hole cluster density is compatible with the recurrent in situ star formation in the innermost parsec of the Galactic centre. We suggest that such a depletion naturally explains the reported lack of stars of the stellar type O and of the Galactic halo hyper-velocity star counterparts within the S-cluster.
Key words: stars: black holes / stars: kinematics and dynamics / Galaxy: center
© The Authors 2025
 Open Access article, published by EDP Sciences, under the terms of the Creative Commons Attribution License (https://creativecommons.org/licenses/by/4.0), which permits unrestricted use, distribution, and reproduction in any medium, provided the original work is properly cited.
This article is published in open access under the Subscribe to Open model. This email address is being protected from spambots. You need JavaScript enabled to view it. to support open access publication.
1. Introduction
The innermost parsec of the Galactic centre is generally believed to host a population of stellar-mass black holes (e.g. Morris 1993; Mouawad et al. 2005). Its structure and properties, however, remain largely unknown despite substantial theoretical (e.g. Miralda-Escudé & Gould 2000; Freitag et al. 2006; Hopman & Alexander 2006; Alexander & Hopman 2009; Merritt 2010; Preto & Amaro-Seoane 2010; Antonini & Merritt 2012; Vasiliev 2017; Generozov et al. 2018; Zhang & Amaro-Seoane 2024) as well as observational (e.g. Hailey et al. 2018; Mori et al. 2021; Zhao et al. 2022) efforts. This is primarily due to the fact that observations of stellar-mass black holes typically rely on the detection of radiation coming from the accreting surrounding material that may not always be available. For this reason, an unknown (and potentially large) fraction of the black hole population may remain undetected. Consequently, observations may map, instead of the black hole population, the distribution of gas in the surveyed region. Recent work of Zhao et al. (2022) reports a few tens of ‘hyper-compact radio sources’ that can represent candidate massive stellar remnants in the central parsec of our Galaxy. The distribution of these sources on the sky closely matches the morphology of the gas streamers known as the minispiral (e.g. Nitschai et al. 2020).
Various possible and non-mutually exclusive sources of the stellar-mass black holes in the Galactic centre have been suggested, each leading to different properties of the resulting black hole population. The black holes may have been born in the larger-scale (a few pc in radius; e.g. Schödel et al. 2014) nuclear star cluster and accumulated in its central parts dynamically. It has been shown by Baumgardt et al. (2018) by means of numerical N-body modelling, however, that during a Hubble-time-long evolution of the nuclear star cluster with repetitive star formation events, only about 300 stellar-mass black holes migrate into the innermost 0.1 pc of the Galactic centre. Hence, despite its great total mass, the nuclear star cluster does not seem to be a very effective source of stellar-mass black holes for its innermost region.
Some of the stellar-mass black holes could be relics from the formation of the supermassive black hole Sgr A⋆ itself in the model of Kroupa et al. (2020). In this model, at the beginning of the formation of a later elliptical galaxy or bulge, a hypermassive star burst cluster of quasar luminosity (Jeřábková et al. 2017) forms at its centre. After the massive stars have died, the more than 105 stellar-mass black holes merge rapidly due to the infall of gas from the still-forming elliptical or bulge, leading to the formation of the supermassive black hole within a few hundred million years, but also most likely leaving a remnant population of stellar-mass black holes in its vicinity. At the moment, however, no literature on the properties of the remnant black holes exists, to our knowledge.
Another way to accumulate stellar-mass black holes in the innermost parts of the Galactic centre is the in situ formation of massive stars in gaseous accretion discs around Sgr A⋆. This is a favourable formation scenario for the young (≈5 Myr) stellar cluster observed between 0.04 pc and 0.5 pc from Sgr A⋆ in projection (e.g. Levin & Beloborodov 2003; Paumard et al. 2006; Bartko et al. 2010; Lu et al. 2013; Yelda et al. 2014; von Fellenberg et al. 2022). This cluster contains more than a hundred very massive OB and Wolf-Rayet stars that will end their lives as black holes. Its overall present-day mass function is top-heavy, presumably due to its formation in the extreme environment that directly yielded such a (perhaps also lower-mass truncated) mass distribution (e.g. Morris 1993; Levin & Beloborodov 2003; Nayakshin et al. 2007; Schödel et al. 2020; Kroupa et al. 2024).
In this Letter, we suggest that repetitive massive star formation in accretion discs around Sgr A⋆ may have given birth to a stellar-mass black hole cluster dense enough to significantly alter the stellar-type abundances below the inner edge of the young stellar cluster through direct collisions and grazing encounters of the individual black holes and stars. Based on this premise, we derive an order-of-magnitude radial density profile for the black hole cluster.
2. The grinder
Star formation in the innermost parsec of our Galaxy is still a matter of an ongoing debate but it was suggested to be recurrent (e.g. Morris & Serabyn 1996). This is based on the notion of a continuous inflow of gas from farther regions that accumulates in the vicinity of Sgr A⋆ and forms massive stars whose winds prevent further gas inflow until they cease due to stellar evolution and the whole cycle repeats itself. If we take the currently observed cluster of young stars as representative of the star formation in the innermost parsec of our Galaxy and assume that such stars have been forming there continuously over cosmological timescales, we can make the following estimate of the resulting stellar-mass black hole number density.
The typical lifetime of a star that ends its life as a black hole can be roughly estimated as 5 Myr. Hence, considering the roughly 100 such stars in the observed young cluster, we arrive at a star formation rate of 2 × 10⁻⁵ yr−1, which yields about 2 × 10⁵ black holes over 10 Gyr. Since the young stars are located mostly within 0.1 pc from Sgr A⋆, the corresponding black hole number density is roughly 2 × 10⁸ pc−3.
The existence of the black hole cluster of the above density would, however, have a significant impact on the stellar population through collisions and close encounters of the stars with the stellar-mass black holes. In order to quantify this, we assume the number density, n•, of the black holes to be constant within the volume of space where the interactions should be occurring. We define a direct collision of the black hole and the subject star as an encounter with the closest approach distance, rper < R⋆, with R⋆ being the physical radius of the star. The rate of such collisions can be written as (Binney & Tremaine 2008)
 (1)
(1)
with tcoll being the time between collisions, σ the velocity dispersion within the black hole cluster, and  the escape speed from the surface of the subject star of mass M⋆; G stands for the gravitational constant.
For simplicity, we assume that these direct collisions lead to destruction of the impacted stars, regardless of the approach velocity. While this assumption is supported by the hydrodynamical models of Kremer et al. (2022) for slow (parabolic) approaches, detailed modelling of faster (hyperbolic) cases is not available at the moment. A population of stellar-mass black holes surrounding Sgr A⋆ thus acts like a ‘star grinder’, with any new star being destroyed by collisions with the black holes on the timescale of tcoll.
3. The ground-down S-cluster and beyond
The star grinding effect is of special relevance for the roughly isotropic cluster of young stars observed closer than 0.04 pc to Sgr A⋆, the so-called S-cluster (Ghez et al. 2003, 2005; Genzel et al. 2003; Paumard et al. 2006; Bartko et al. 2010; Lu et al. 2013; Yelda et al. 2014; Habibi et al. 2017; von Fellenberg et al. 2022). Its formation scenario is still debated but the S-cluster seems to be equally as old as the young stars beyond 0.04 pc from Sgr A⋆ (Habibi et al. 2017).
The two young stellar structures, however, differ dramatically in the abundance of the most massive stars. While observations of the S-cluster revealed about two dozen B stars, no star of spectral type O was found there. This is in striking contrast with the observations of the directly neighbouring cluster of young stars at distances larger than 0.04 pc from Sgr A⋆ where the numbers of the observed O and B stars are similar (about 100; von Fellenberg et al. 2022). Although different star formation conditions may be invoked, it is tempting to estimate the effect of ‘the grinder’ given the astrophysical conditions within the S-cluster, which may relax the need for different initial mass functions in the two neighbouring regions.
Assuming there was a population of O stars also initially present within the S-cluster but entirely destroyed by the direct collisions with the stellar-mass black holes within the age (≈5 Myr) of their still-living supposed siblings located farther away, the necessary black hole number density, n•, can be estimated as follows. We set tcoll ≈ 5 Myr and σ ≈ 1100 km/s equalling the orbital (circular) velocity around Sgr A⋆ at a representative distance of 0.015 pc from Sgr A⋆. For a representative O star, we set its mass to be M⋆O = 50 M⊙, where M⊙ stands for the mass of the Sun. According to the mass-radius relation of Demircan & Kahraman (1991), R⋆ = 0.85 M⋆0.67, we get R⋆O ≈ 12 R⊙, where R⊙ denotes the Solar radius, and the escape speed thus is v⋆O ≈ 1260 km/s. The resulting black hole number density given by Eq. (1) is then n• ≈ 2 × 10⁸ pc−3. Remarkably, this value is in agreement with the black hole number density estimate based on the star formation arguments given in Sect. 2.
If we now assume the obtained n•, we can estimate the destruction time for stars of any other spectral type and, specifically, for the stars of the spectral type B that are present within the S-cluster. For the representative B star, M⋆B = 10 M⊙, R⋆B ≈ 4 R⊙, and v⋆B ≈ 970 km/s. Consequently, 1/tcoll ≈ 1/55 Myr−1. Hence, while the O stars within the S-cluster are destroyed in about 5 Myr, it takes 55 Myr to shatter the B stars. As a result, the about 5 Myr old B stars in the S-cluster can still be observed (see Fig. 1).
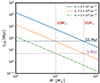 |
Fig. 1. Collision time, tcoll, as a function of stellar mass, M⋆ (Eq. (1)), for three different values of the black hole number density, n•. The horizontal dot-dot-dashed purple and dark blue lines denote the collision times of 5 Myr and 55 Myr for the representative O and B stars of masses 50 M⊙ and 10 M⊙ (indicated by the vertical dotted brick-red lines), respectively, derived for n• = 2 × 10⁸ pc−3. In all cases, the velocity dispersion is set to the orbital (circular) velocity around Sgr A⋆ at the representative distance of 0.015 pc from Sgr A⋆ and the mass-radius relation of Demircan & Kahraman (1991), R⋆ = 0.85 M⋆0.67, is assumed. |
3.1. Radial density profile of the black hole cluster
If we assume that the initial mass function of the S-cluster and the young star cluster above 0.04 pc from Sgr A⋆ were at least similar at their high-mass ends, we can use the currently observed occurrence of stellar types to constrain the radial density profile of the stellar-mass black hole cluster. In doing so, we implicitly assume that the distribution of the stellar types of the massive young stars has been directly sculpted by the black holes. We note that this is where our approach diverges from the usual considerations (e.g. Dale et al. 2009; Davies et al. 2011) in which some radial density profile of the black hole cluster is assumed to investigate the impact of the black holes on the environment.
In particular, since stars of stellar type B are observed within the S-cluster, n• cannot reach values ≳2 × 10⁹ pc−3 there. Such a high black hole number density would lead to the collisional destruction of the B stars within their estimated age of 5 Myr (see Fig. 1). While this rather generous upper limit applies for the S-cluster as a whole, a stronger constraint has recently been placed on the innermost part of the S-cluster. Analyses of multiple stellar orbits there (GRAVITY Collaboration 2022, 2024) generally suggest that no more than about 5 × 10³ M⊙ (3σ limit) of extended mass is present within the orbital apocentre of the S2 star; that is, below 0.01 pc. Depending on the extended mass radial density profile assumed, this upper limit may be even smaller by up to a factor of ≈5 (GRAVITY Collaboration 2024). In the case of the constant black hole number density, the derived constraint for that region reads n• ≲ 5 × 10⁷ pc−3 (see Fig. 2, region I).
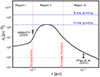 |
Fig. 2. Suggested constraints on radial number density profile, n•(r), of the stellar-mass black hole cluster as a function of radial distance, r, from the Sgr A⋆ supermassive black hole are plotted together with an arbitrary distribution function (solid ‘bumpy’ black line) fulfilling these constraints. The vertical dotted red lines mark the boundaries between regions I, II, and III in which the impact of the black holes is qualitatively different. The horizontal dashed lines mark the density of the black holes for which O and B stars would be ground down in 5 Myr. The observational constraints based on the GRAVITY Collaboration (2024) enclosed mass limits and on a subsample of the hypercompact radio sources from Zhao et al. (2022) are depicted by the x-shaped points with arrows at the corresponding distances from Sgr A⋆. The purpose of the dotted grey lines is to guide the eye of the reader to the particular density values. |
This latter constraint implies that most of the ‘grinding’ black holes need to be located beyond the orbit of the S2 star but still within the S-cluster; that is, roughly between 0.01 pc and 0.04 pc from Sgr A⋆ (see Fig. 2, region II). In this region, their density should thus be the highest, roughly reaching the grinding value of n• ≈ 2 × 10⁸ pc−3.
Beyond the outer boundary of the S-cluster, at distances ≳0.04 pc from Sgr A⋆ (see Fig. 2, region III), stars of stellar type O are abundant, suggesting that n• < 2 × 10⁸ pc−3 there again. This constraint for the outer regions is in agreement with the observations of the hyper-compact radio sources reported in Zhao et al. (2022). According to their Fig. 1, the sources are most abundant around the IRS 13E complex, where about 10 of those labelled as candidate massive stellar remnants are located within a circle of roughly 0.03 pc in radius. The corresponding number density within a sphere of such a radius is about 105 pc−3.
Since the primary source of the stellar-mass black holes in our ‘grinder’ model is the recurrent massive star formation in (presumably similar) accretion discs around Sgr A⋆, the resulting black hole cluster is likely to be compact. The black hole number density, n•, is thus probably steeply decreasing over a few times 0.1 pc from Sgr A⋆ down to the values given by the stellar-dynamical evolution of the background larger-scale nuclear star cluster. These are negligible from the perspective taken here, as they are necessarily smaller than about 3 × 10⁴ pc−3, a value obtained for the 300 black holes found within 0.1 pc from Sgr A⋆ according to the paper of Baumgardt et al. (2018).
The above-sketched radial density profile of the black hole cluster exhibits a maximum just below or near the outer boundary of the S-cluster (see the solid black curve in Fig. 2, region II). Such a bump-like shape was predicted to be a possible result of the dynamical evolution of the stellar-mass black hole population against a shallow-cusp stellar background (Merritt 2010). A shallow-cusp radial density profile of the old stellar population has indeed been observationally confirmed recently down to about 0.02 pc from Sgr A⋆ (Habibi et al. 2019). Furthermore, the hyper-compact radio sources (representing candidate massive stellar remnants) reported in Zhao et al. (2022) also show a bump-like profile. Hence, even though the theoretical modelling is sensitive to the choice of the underlying model (cf. e.g. Generozov et al. 2018, who did not find any bump for their set-up) and the observational detections of massive stellar remnants are likely not complete, the qualitative agreement with our independent results represents a strong supportive argument for the existence of the stellar-mass black hole bump in the Galactic centre.
3.2. Hypervelocity-star counterparts
Observations of the Galactic halo have revealed about two dozen stars moving with velocities higher than the escape speed from the Galaxy, so-called hypervelocity stars, some of which seem to have flight directions compatible with a Galactocentric origin (Brown et al. 2014, 2018). One of the explanations for the existence of such hypervelocity stars is the Hills mechanism (Hills 1988) occurring in the vicinity of Sgr A⋆, which is the tidal disruption of a binary star close enough to the supermassive black hole. Upon such a disruption, one of the original binary components is left on a tight orbit around the supermassive black hole, while the other is ejected with a high velocity away from it.
The observed hypervelocity stars are of spectral type B and are found at distances of about 50 kpc from the Galactic centre. Assuming an average velocity of about 1000 km/s, these stars thus needed about 50 Myr to get to their observed positions, which provides a lower estimate of their ages. Hence, their equally old counterparts of the same spectral type (assuming a realistic pairing in the original binaries) left in the S-cluster should still be observed there. Although a detailed stellar-age survey of the S-cluster still needs to be done, the B stars analyzed so far within this cluster are all younger than 25 Myr (Habibi et al. 2017).
Based on the grinding timescale of 55 Myr derived for B stars in this Letter, we suggest that while the young B stars can still be observed within the S-cluster, the older hypervelocity-star counterparts were already destroyed by the collisions with the stellar-mass black holes.
4. Discussion
Using two independent methods (continuous massive star formation and their collisional grinding), we have obtained the same estimate of the stellar-mass black hole number density, n• ≈ 2 × 10⁸ pc−3, within the S-cluster. This value is rather high and it may be considered an upper limit.
If we assumed such a density for the region between 0.015 pc and 0.025 pc from Sgr A⋆, the total number of the black holes there would be about 104. If we further set the mass, m•, of each individual black hole to be m• = 10 M⊙, the corresponding total mass of the black-hole component of the S-cluster would be 105 M⊙. We note that these numbers are very rough estimates based on a simplified model of constant n• within a representative volume such that the black holes orbitally cover the outer part of the S-cluster (see Fig. 2, region II). The true values are dependent on the particular overall shape and dimensions, density profile, and internal dynamics of the black hole cluster, which are at the moment unknown. At the same time, it is not clear how to extrapolate the black hole cluster radial density profile to the regions where the currently available observational constraints directly apply (Boehle et al. 2016; GRAVITY Collaboration 2022, 2024). For this purpose, more detailed investigations of the black hole cluster properties beyond the scope of this Letter are necessary.
The demands on the black hole number density, n•, are somewhat decreased if we consider that in addition to the direct collisions, grazing encounters of stars and the black holes can occur. Such encounters are more frequent than the direct collisions due to their larger cross-section and they can cause a significant tidal stripping of stellar upper layers. The resulting mass loss effectively changes O stars to stars of spectral type B, which enhances the disproportion of O relative to B stars within the S-cluster. Owing to the very short Kelvin-Helmholtz timescale of a B star of about 105 yr, the affected stars would likely be observable as normal main-sequence stars. Multiple subsequent grazing encounters may also eventually lead to a complete destruction of the original O star.
If we define a grazing encounter of the black hole and the subject star as an encounter with the closest approach distance, rper, such that the star entirely fills its Roche lobe, we obtain rper ≈ 1.6 R⋆ for a pair consisting of a 50 M⊙ O star and a 10 M⊙ black hole. The corresponding cross-section will thus be about a factor of 2.6 larger, reducing the grinding black hole number density, n•, by up to the same factor (multiple grazing encounters may be necessary for a significant mass loss). We note that smaller required values of n• due to the grazing encounters also lower the demands on the necessary black hole formation rate.
A very important aspect of the model introduced here that relies on close interactions of the stars and the black holes (and thus requires a large value of n•) is the temporal evolution of the black hole cluster density profile. The course of this evolution, however, not only depends on the initial set-up of the black hole cluster (as well as the whole larger-scale embedding stellar cluster) but can also be affected by further components of the system that are not considered in this Letter. In particular, the recurrently infalling gas would, in addition to fuelling the repetitive star (and thus black hole) formation, also lead to dissipative interactions, and thus shrinkage of the orbits of the black holes. Furthermore, a possible population of stellar-mass black holes left over from the formation of Sgr A⋆ itself (Kroupa et al. 2020) might mitigate the impact of the overall outward diffusion of the black holes (Generozov et al. 2018) driven by their two-body encounters. Due to this complexity, we leave a more detailed investigation of the long-term stability of the black hole cluster to future work.
4.1. Dust-enshrouded objects
Observations have revealed a population of dust-enshrouded objects near the outer boundary of the S-cluster (Ciurlo et al. 2020; Peißker et al. 2020, 2024). Their formation scenario is still a matter of an ongoing debate but they are believed to contain stellar cores of masses of a few solar masses. During the grazing encounters of the black holes and stars considered here, some fraction of the stripped stellar material can stay bound to the parent star (stellar core) and condense to dust grains, leading to the formation of a dust-enshrouded object. We thus suggest that these interactions may naturally explain the existence of the observed dust-enshrouded objects.
4.2. Further considerations
So far, we have been investigating the interaction of young stars and the stellar-mass black holes on the timescale of a few dozen million years, considering the constraints on the two populations derived from the observations of the current state of the Galactic centre. In order to evaluate the interaction for older stars on longer timescales, the stellar-dynamical evolution of both populations, including the recurrent star formation episodes, would have to be taken into account, which is beyond the scope of this Letter.
Apart from physically affecting the stellar population, the rather numerous stellar-mass black holes should also manifest themselves by gravitational lensing of the individual stars within the S-cluster (or matter accreting onto Sgr A⋆ itself). Occasionally, this can lead to the emergence of transient stars that are otherwise too faint to be detectable. Such stars could be searched for in the already existing observational data.
Since the astrophysical conditions in the vicinity of Sgr A⋆ can be regarded as rather generic than exceptional among the supermassive black hole hosting galactic nuclei, the hypothesis presented in this Letter is likely to be widely applicable. The analysis of the combined gravitational waves signal coming from the dynamically evolving dense black hole clusters in nearby galaxies could thus also provide useful insights into their evolution.
5. Conclusions
In this Letter, we have investigated the impact of the direct collisions and grazing encounters of the stellar-mass black holes and stars in the Galactic centre, considering three qualitatively different formation channels for the black holes. Based on the obtained results, we have constructed an order of magnitude radial density profile of the black hole cluster.
In particular, we have found that the spatial number density of the black holes can reach the order of magnitude of 108 pc−3 within the outer parts of the S-cluster (roughly at distances 0.01–0.04 pc from the Sgr A⋆) if they originate from the recurrent massive star formation in accretion discs around Sgr A⋆. The direct collisions (and grazing encounters) of such densely distributed stellar-mass black holes with the individual stars lead to the depletion of the most massive (and thus largest) stars on the timescale of a few million years. Such a depletion can thus explain the reported absence of stars of stellar type O and of the Galactic halo hypervelocity-star counterparts within the S-cluster.
Observationally confirmed stars within the S-cluster that are of spectral type B and a few million years old rule out a black hole density of the order of magnitude of 109 pc−3 there. Similarly, the abundant O stars farther than 0.04 pc from Sgr A⋆ (i.e. beyond the outer boundary of the S-cluster) suggest a lower density of the stellar-mass black holes in that region (a few times 107 pc−3 or less). Our results further suggest a bump-like shape of the black hole cluster radial density profile, with the inner decline roughly within the orbital apocentre of the S2 star (closer than 0.01 pc to Sgr A⋆).
Acknowledgments
We thank the anonymous referee for their useful comments that helped to improve this manuscript. PK acknowledges support through the DAAD Eastern-European Bonn-Prague exchange programme. MS is supported by the Grant Agency of Charles University under the grant no. 179123.
References
- Alexander, T., & Hopman, C. 2009, ApJ, 697, 1861 [NASA ADS] [CrossRef] [Google Scholar]
- Antonini, F., & Merritt, D. 2012, ApJ, 745, 83 [NASA ADS] [CrossRef] [Google Scholar]
- Bartko, H., Martins, F., Trippe, S., et al. 2010, ApJ, 708, 834 [Google Scholar]
- Baumgardt, H., Amaro-Seoane, P., & Schödel, R. 2018, A&A, 609, A28 [NASA ADS] [CrossRef] [EDP Sciences] [Google Scholar]
- Binney, J., & Tremaine, S. 2008, Galactic Dynamics, 2nd edn. (Princeton and Oxford, USA: Princeton University Press) [Google Scholar]
- Boehle, A., Ghez, A. M., Schödel, R., et al. 2016, ApJ, 830, 17 [Google Scholar]
- Brown, W. R., Geller, M. J., & Kenyon, S. J. 2014, ApJ, 787, 89 [Google Scholar]
- Brown, W. R., Lattanzi, M. G., Kenyon, S. J., & Geller, M. J. 2018, ApJ, 866, 39 [Google Scholar]
- Ciurlo, A., Campbell, R. D., Morris, M. R., et al. 2020, Nature, 577, 337 [Google Scholar]
- Dale, J. E., Davies, M. B., Church, R. P., & Freitag, M. 2009, MNRAS, 393, 1016 [Google Scholar]
- Davies, M. B., Church, R. P., Malmberg, D., et al. 2011, Proceedings of a workshop held at Shanghai, China on October 19–23, 2009, eds. M. R. Morris, Q.~D. Wang & F. Yuan (San Francisco: Astronomical Society of the Pacific), 2011, 439, 212 [Google Scholar]
- Demircan, O., & Kahraman, G. 1991, Ap&SS, 181, 313 [Google Scholar]
- von Fellenberg, S. D., Gillessen, S., Stadler, J., et al. 2022, ApJ, 932, L6 [NASA ADS] [CrossRef] [Google Scholar]
- Freitag, M., Amaro-Seoane, P., & Kalogera, V. 2006, ApJ, 649, 91 [NASA ADS] [CrossRef] [Google Scholar]
- Generozov, A., Stone, N. C., Metzger, B. D., & Ostriker, J. P. 2018, MNRAS, 478, 4030 [Google Scholar]
- Genzel, R., Schödel, R., Ott, T., et al. 2003, ApJ, 594, 812 [Google Scholar]
- Ghez, A. M., Duchêne, G., Matthews, K., et al. 2003, ApJ, 586, L127 [Google Scholar]
- Ghez, A. M., Salim, S., Hornstein, S. D., et al. 2005, ApJ, 620, 744 [NASA ADS] [CrossRef] [Google Scholar]
- GRAVITY Collaboration (Abuter, R., et al.) 2022, A&A, 657, L12 [NASA ADS] [CrossRef] [Google Scholar]
- GRAVITY Collaboration (Abd El Dayem, K., et al.) 2024, A&A, 692, A242 [NASA ADS] [CrossRef] [EDP Sciences] [Google Scholar]
- Habibi, M., Gillessen, S., Martins, F., et al. 2017, ApJ, 847, 120 [Google Scholar]
- Habibi, M., Gillessen, S., Pfuhl, O., et al. 2019, ApJ, 872, L15 [Google Scholar]
- Hailey, C. J., Mori, K., Bauer, F. E., et al. 2018, Nature, 556, 70 [Google Scholar]
- Hills, J. G. 1988, Nature, 331, 687 [Google Scholar]
- Hopman, C., & Alexander, T. 2006, ApJ, 645, L133 [NASA ADS] [CrossRef] [Google Scholar]
- Jeřábková, T., Kroupa, P., Dabringhausen, J., Hilker, M., & Bekki, K. 2017, A&A, 608, A53 [Google Scholar]
- Kremer, K., Lombardi, J. C., Jr., Lu, W., Piro, A. L., & Rasio, F. A. 2022, ApJ, 933, 203 [NASA ADS] [CrossRef] [Google Scholar]
- Kroupa, P., Subr, L., Jerabkova, T., & Wang, L. 2020, MNRAS, 498, 5652 [Google Scholar]
- Kroupa, P., Gjergo, E., Jerabkova, T., & Yan, Z. 2024, arXiv e-prints [arXiv:2410.07311] [Google Scholar]
- Levin, Y., & Beloborodov, A. M. 2003, ApJ, 590, L33 [NASA ADS] [CrossRef] [Google Scholar]
- Lu, J. R., Do, T., Ghez, A. M., et al. 2013, ApJ, 764, 155 [NASA ADS] [CrossRef] [Google Scholar]
- Merritt, D. 2010, ApJ, 718, 739 [NASA ADS] [CrossRef] [Google Scholar]
- Miralda-Escudé, J., & Gould, A. 2000, ApJ, 545, 847 [CrossRef] [Google Scholar]
- Mori, K., Hailey, C. J., Schutt, T., et al. 2021, ApJ, 921, 148 [NASA ADS] [CrossRef] [Google Scholar]
- Morris, M. 1993, ApJ, 408, 496 [NASA ADS] [CrossRef] [Google Scholar]
- Morris, M., & Serabyn, E. 1996, ARA&A, 34, 645 [Google Scholar]
- Mouawad, N., Eckart, A., Pfalzner, S., et al. 2005, Astron. Nachr., 326, 83 [NASA ADS] [CrossRef] [Google Scholar]
- Nayakshin, S., Cuadra, J., & Springel, V. 2007, MNRAS, 379, 21 [Google Scholar]
- Nitschai, M. S., Neumayer, N., & Feldmeier-Krause, A. 2020, ApJ, 896, 68 [NASA ADS] [CrossRef] [Google Scholar]
- Paumard, T., Genzel, R., Martins, F., et al. 2006, ApJ, 643, 1011 [NASA ADS] [CrossRef] [Google Scholar]
- Peißker, F., Hosseini, S. E., Zajaček, M., et al. 2020, A&A, 634, A35 [NASA ADS] [CrossRef] [EDP Sciences] [Google Scholar]
- Peißker, F., Zajaček, M., Melamed, M., et al. 2024, A&A, 686, A235 [NASA ADS] [CrossRef] [EDP Sciences] [Google Scholar]
- Preto, M., & Amaro-Seoane, P. 2010, ApJ, 708, L42 [NASA ADS] [CrossRef] [Google Scholar]
- Schödel, R., Feldmeier, A., Kunneriath, D., et al. 2014, A&A, 566, A47 [Google Scholar]
- Schödel, R., Nogueras-Lara, F., Gallego-Cano, E., et al. 2020, A&A, 641, A102 [Google Scholar]
- Vasiliev, E. 2017, ApJ, 848, 10 [NASA ADS] [CrossRef] [Google Scholar]
- Yelda, S., Ghez, A. M., Lu, J. R., et al. 2014, ApJ, 783, 131 [Google Scholar]
- Zhang, F., & Amaro-Seoane, P. 2024, ApJ, 961, 232 [NASA ADS] [CrossRef] [Google Scholar]
- Zhao, J.-H., Morris, M. R., & Goss, W. M. 2022, ApJ, 927, L6 [NASA ADS] [CrossRef] [Google Scholar]
All Figures
|
Fig. 1. Collision time, tcoll, as a function of stellar mass, M⋆ (Eq. (1)), for three different values of the black hole number density, n•. The horizontal dot-dot-dashed purple and dark blue lines denote the collision times of 5 Myr and 55 Myr for the representative O and B stars of masses 50 M⊙ and 10 M⊙ (indicated by the vertical dotted brick-red lines), respectively, derived for n• = 2 × 10⁸ pc−3. In all cases, the velocity dispersion is set to the orbital (circular) velocity around Sgr A⋆ at the representative distance of 0.015 pc from Sgr A⋆ and the mass-radius relation of Demircan & Kahraman (1991), R⋆ = 0.85 M⋆0.67, is assumed. |
| In the text | |
|
Fig. 2. Suggested constraints on radial number density profile, n•(r), of the stellar-mass black hole cluster as a function of radial distance, r, from the Sgr A⋆ supermassive black hole are plotted together with an arbitrary distribution function (solid ‘bumpy’ black line) fulfilling these constraints. The vertical dotted red lines mark the boundaries between regions I, II, and III in which the impact of the black holes is qualitatively different. The horizontal dashed lines mark the density of the black holes for which O and B stars would be ground down in 5 Myr. The observational constraints based on the GRAVITY Collaboration (2024) enclosed mass limits and on a subsample of the hypercompact radio sources from Zhao et al. (2022) are depicted by the x-shaped points with arrows at the corresponding distances from Sgr A⋆. The purpose of the dotted grey lines is to guide the eye of the reader to the particular density values. |
| In the text | |
Current usage metrics show cumulative count of Article Views (full-text article views including HTML views, PDF and ePub downloads, according to the available data) and Abstracts Views on Vision4Press platform.
Data correspond to usage on the plateform after 2015. The current usage metrics is available 48-96 hours after online publication and is updated daily on week days.
Initial download of the metrics may take a while.