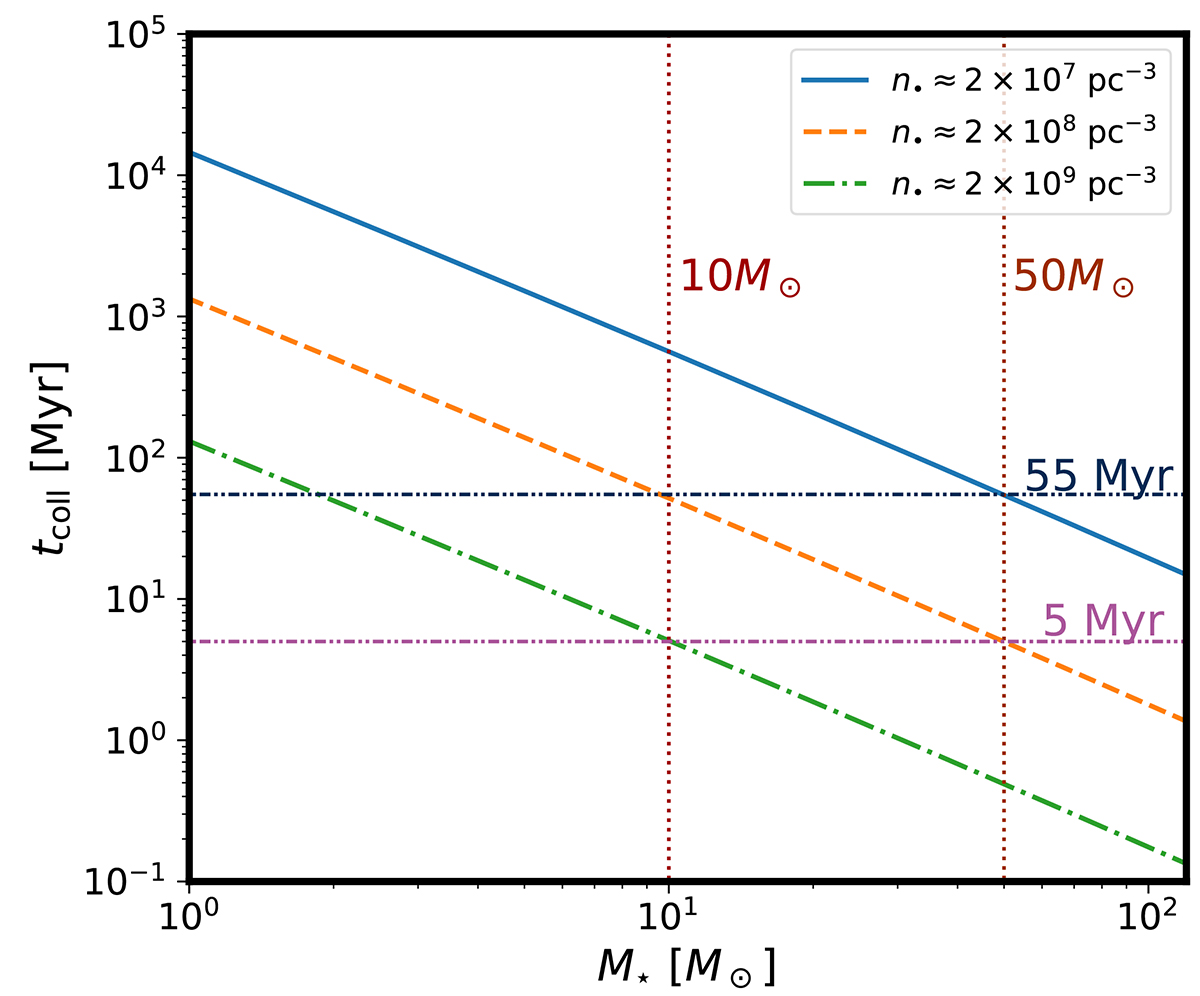
Fig. 1.
Download original image
Collision time, tcoll, as a function of stellar mass, M⋆ (Eq. (1)), for three different values of the black hole number density, n•. The horizontal dot-dot-dashed purple and dark blue lines denote the collision times of 5 Myr and 55 Myr for the representative O and B stars of masses 50 M⊙ and 10 M⊙ (indicated by the vertical dotted brick-red lines), respectively, derived for n• = 2 × 10⁸ pc−3. In all cases, the velocity dispersion is set to the orbital (circular) velocity around Sgr A⋆ at the representative distance of 0.015 pc from Sgr A⋆ and the mass-radius relation of Demircan & Kahraman (1991), R⋆ = 0.85 M⋆0.67, is assumed.
Current usage metrics show cumulative count of Article Views (full-text article views including HTML views, PDF and ePub downloads, according to the available data) and Abstracts Views on Vision4Press platform.
Data correspond to usage on the plateform after 2015. The current usage metrics is available 48-96 hours after online publication and is updated daily on week days.
Initial download of the metrics may take a while.