Fig. 2.
Download original image
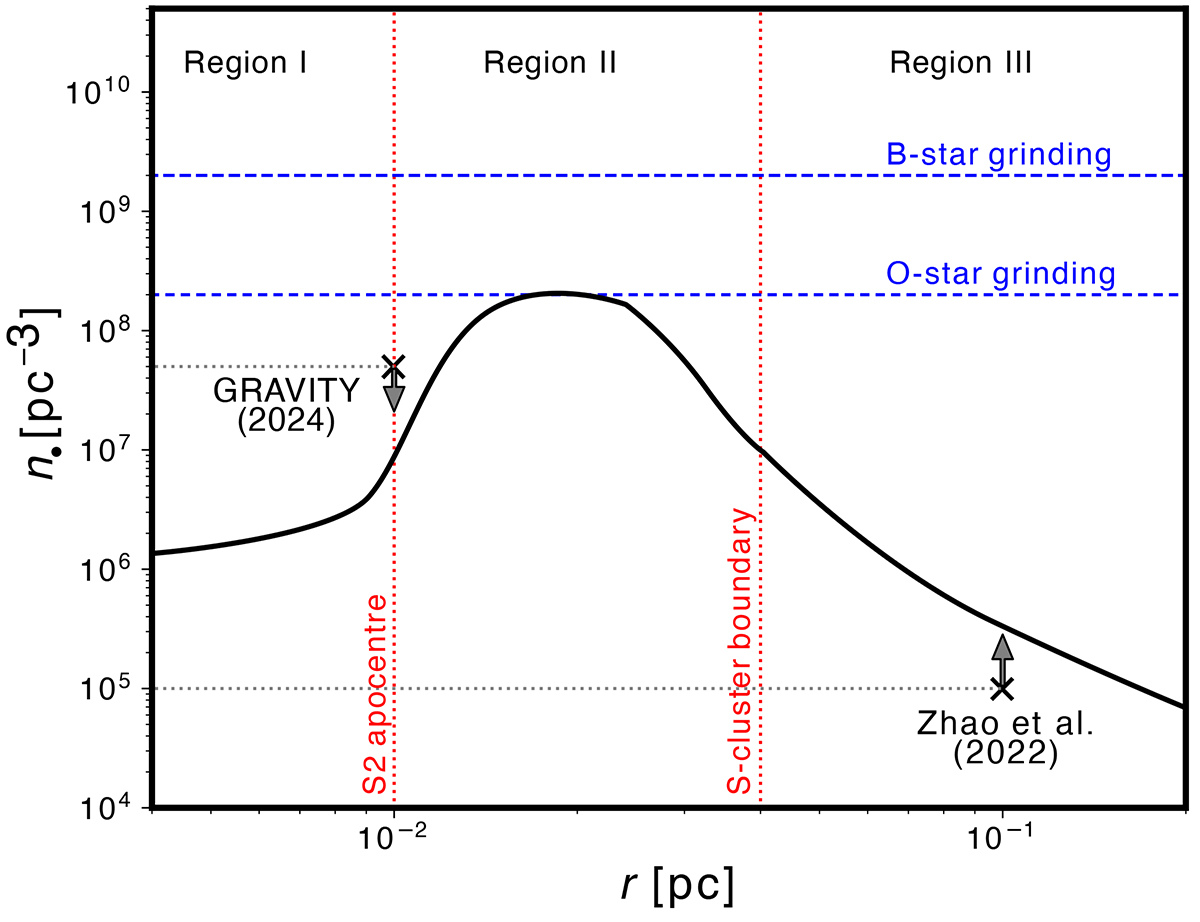
Suggested constraints on radial number density profile, n•(r), of the stellar-mass black hole cluster as a function of radial distance, r, from the Sgr A⋆ supermassive black hole are plotted together with an arbitrary distribution function (solid ‘bumpy’ black line) fulfilling these constraints. The vertical dotted red lines mark the boundaries between regions I, II, and III in which the impact of the black holes is qualitatively different. The horizontal dashed lines mark the density of the black holes for which O and B stars would be ground down in 5 Myr. The observational constraints based on the GRAVITY Collaboration (2024) enclosed mass limits and on a subsample of the hypercompact radio sources from Zhao et al. (2022) are depicted by the x-shaped points with arrows at the corresponding distances from Sgr A⋆. The purpose of the dotted grey lines is to guide the eye of the reader to the particular density values.
Current usage metrics show cumulative count of Article Views (full-text article views including HTML views, PDF and ePub downloads, according to the available data) and Abstracts Views on Vision4Press platform.
Data correspond to usage on the plateform after 2015. The current usage metrics is available 48-96 hours after online publication and is updated daily on week days.
Initial download of the metrics may take a while.