| Issue |
A&A
Volume 695, March 2025
|
|
|---|---|---|
| Article Number | A79 | |
| Number of page(s) | 17 | |
| Section | Extragalactic astronomy | |
| DOI | https://doi.org/10.1051/0004-6361/202453250 | |
| Published online | 07 March 2025 | |
EZOA: Nançay H I follow-up observations in the Zone of Avoidance
1
Max-Planck-Institut für extraterrestrische Physik, Gießenbachstraße 1, 85748 Garching, Germany
2
LUX, Observatoire de Paris, Université PSL, Sorbonne Université, CNRS, 5 place Jules Janssen, 92190 Meudon, France
3
Observatoire Radioastronomique de Nançay, Observatoire de Paris, Université PSL, Université d’Orléans, 18330 Nançay, France
4
Department of Astronomy, University of Cape Town, Private Bag X3, Rondebosch 7701, South Africa
5
Université Paris-Cité, 143 avenue de Versailles, 75016 Paris, France
⋆ Corresponding author; This email address is being protected from spambots. You need JavaScript enabled to view it.
Received:
2
December
2024
Accepted:
23
January
2025
Abstract
We present follow-up 21 cm H I line observations made with the Nançay Radio Telescope (NRT) of 99 weak or potential detections of galaxies from the EZOA catalogue in the northern Zone of Avoidance (ZoA), which were extracted from the shallow version of the EBHIS blind H I survey performed with the Effelsberg radio telescope. The new NRT observations are on average almost three times as sensitive as those from EBHIS. Of the 99 observed sources, we confirmed 72, while three yielded inconclusive results. We find that the quality assessment of the EZOA catalogue entries correlates well with the NRT recovery rate; for instance, only four of the 22 potential detections could be confirmed. Due to the higher sensitivity as well as the large north-south extent of the NRT beam, the NRT observations also yielded five serendipitous detections, which we include here. We updated the EZOA catalogue with the improved H I parameters and detections. To test the mitigation of radio frequency interference signals, we also observed selected sources using a dedicated receiver and data processing system.
Key words: surveys / galaxies: distances and redshifts / galaxies: fundamental parameters / large-scale structure of Universe / radio lines: galaxies
© The Authors 2025
 Open Access article, published by EDP Sciences, under the terms of the Creative Commons Attribution License (https://creativecommons.org/licenses/by/4.0), which permits unrestricted use, distribution, and reproduction in any medium, provided the original work is properly cited.
This article is published in open access under the Subscribe to Open model.
Open Access funding provided by Max Planck Society.
1. Introduction
Our current understanding of the local Universe – such as large-scale structures and the dynamics related to their gravitational pull – is still incomplete due to the difficulties in finding galaxies near the obscured Galactic plane, the so-called Zone of Avoidance (ZoA). Even when low-latitude galaxies are identified in the optical or near-infrared (NIR), obtaining reliable redshifts from an optical spectrum remains extremely difficult (Macri et al. 2019).
The ZoA is known to obscure and bisect major parts of dynamically important structures such as the Great Attractor (GA; Dressler et al. 1987; Kraan-Korteweg et al. 1996, and Woudt et al. 2004), the Perseus-Pisces supercluster (PPS; Focardi et al. 1984 and Chamaraux et al. 1990), and the Local Void (LV; Tully et al. 2008 and Tully et al. 2019). Furthermore, newly identified low-latitude structures are still being discovered to date, such as the massive Vela supercluster (VSCL; Kraan-Korteweg et al. 2017) at cz ∼ 18 500 km s−1, which may contribute a significant component to the (residual) bulk flow motion (e.g. Hudson et al. 2004 and Springob et al. 2016).
Observations of the 21 cm spectral line of neutral hydrogen (H I) of galaxies is one of the most successful methods of penetrating the obscuring dust layers and crowded star fields along the plane of our Galaxy. Their H I line profiles furthermore provide an immediate measure of their redshift as well as insight into certain properties such as their total H I mass. H I surveys therefore are essential for obtaining a comprehensive and complete three-dimensional picture of the large-scale structures in the local Universe, unaffected by absorption of the optical and NIR emission of galaxies.
For these reasons, numerous systematic large-area H I surveys have been undertaken, mostly with single-dish radio telescopes, but also, more recently, with interferometers (e.g. Ramatsoku et al. 2016). Pointed H I observations of optical or NIR-selected ZoA galaxy samples are complementary to the ‘blind’ surveys and remain important. Blind surveys are often quite shallow, and many galaxies can go undetected if their H I mass or signal-to-noise ratios (S/Ns) are low – the latter especially for galaxies with broad line widths. Furthermore, cross-correlating the H I emission with an optical or NIR counterpart can be used to determine peculiar velocities using the Tully–Fisher relation.
Pointed H I observations of optically detected ZoA galaxies and galaxies in the 2MASS bright ZoA catalogue (2MZOA Schröder et al. 2019b) were performed using both the Parkes 64 m radio telescope (e.g. Kraan-Korteweg et al. 2002; Schröder et al. 2009 and Said et al. 2016) and the 100 m class Nançay Radio Telescope (NRT; van Driel et al. 2009 and Kraan-Korteweg et al. 2018). These studies have proved quite effective in complementing the optically and NIR-selected galaxy catalogues in the southern and northern ZoA, respectively. On the other hand, only blind H I surveys can detect galaxies independent of the dust and star density deep in the plane and obtain a truly all-sky census of the galaxy distribution within the ZoA.
To date, systematic blind H I surveys have homogeneously covered the southern hemisphere out to cz ∼ 12 700 km s−1 with the Multibeam receiver on the 64 m Parkes dish, namely HIPASS and its northern extension (δ < +25°; Meyer et al. 2004 and Wong et al. 2006, respectively) with a typical root mean square (rms) noise of 13 mJy beam−1. In addition, the deeper Parkes HIZOA survey has an rms noise of 6 mJy beam−1 and was dedicated to the deeply obscured inner part of the ZoA (|b|< 5°; Staveley-Smith et al. 2016 and Donley et al. 2005, respectively). Recently, significantly deeper H I surveys have become available for the innermost ( ) southern ZoA. For example, an extraction of H I data from the SARAO (South African Radio Astronomy Observatory) MeerKAT Galactic Plane Legacy Survey (SMGPS; Goedhart et al. 2024), for the redshift range cz < 25 000 km s−1 and with a median rms noise level of ∼0.45 mJy beam−1, provided tantalising new insights into the LV (Kurapati et al. 2024), the Ophiuchus supercluster (Louw et al. 2024), the GA region (Steyn et al. 2024), and the more distant VSCL (Rajohnson et al. 2024).
However, in the northern sky (i.e.  ) no such systematic blind H I survey existed before 2019. The northern ZoA was surveyed with the 25 m Dwingeloo telescope, but at a high rms noise of 40 mJy beam−1 (Henning et al. 1998; Rivers et al. 1999), while the HIJASS survey (Lang et al. 2003), conducted with the 76 m Lovell telescope at Jodrell Bank, only covered parts of the northern sky at a sensitivity comparable to HIPASS (rms = 13 − 16 mJy). Parts of the ZoA regions that were accessible by the 305 m Arecibo telescope were covered by the ALFAZOA surveys, comprising the Shallow ALFAZOA survey (Sanchez-Barrantes et al. 2019) covering latitudes |b|< 10° with an rms noise of 5 − 7 mJy beam−1, and the Deep ALFAZOA survey (Henning et al. 2008; McIntyre et al. 2015) covering a much narrower strip in Galactic latitude (|b|< 2°) with an rms noise of 1 mJy beam−1. We note that the main ALFALFA survey did not cover the ZoA (see Haynes & Giovanelli 2018).
To complement the systematic southern surveys, the blind Effelsberg–Bonn H I Survey (EBHIS; Kerp et al. 2011 and Winkel et al. 2010) was launched. It has homogeneously surveyed the entire northern sky (δ ≥ −5°) with the 100 m Effelsberg radio telescope out to cz = 18 000 km s−1 at a nominal rms noise of 16 mJy, comparable to HIPASS in the southern sky. For the northern ZoA, Schröder et al. (2019a) compiled the so-called EZOA catalogue with 170 detections extracted from the shallower (first-pass) EBHIS survey, which has an rms noise level of 23 mJy beam−1 (Flöer et al. 2014).
In this paper, we present higher-sensitivity follow-up observations obtained with the 100 m-class NRT to confirm or improve H I signals of 77 selected EZOA detections and 22 EZOA candidates. We note that compared to the cube rms level of the EBHIS data, the median rms noise of the detected EZOA sources is lower (10.4 mJy beam−1; Schröder et al. 2019a). For our follow-up observations, we aimed to reach a 3 mJy rms noise level, similar to our NRT observations of 2MASS bright galaxies (Kraan-Korteweg et al. 2018). We also performed radio frequency interference (RFI) mitigation test observations of a few selected sources, using a dedicated receiver and data analysis system.
This paper is organised as follows. In Sect. 2, the selection of the observed sources is described, and in Sect. 3, the observations and data reduction. Section 4 presents the results, which are discussed in Sect. 5, finishing with a summary in Sect. 6. Notes on selected sources are presented in Appendix A, and the tables and H I spectra in Appendix B.
Throughout the paper, we use a Hubble constant of H0 = 75 km s−1 Mpc−1. For convenience, we introduce the angular distance parameter, b, which is expressed in units of the radius of the elliptically shaped NRT beam. The beam radius is defined as the angular distance from the pointing centre at which the telescope gain has diminished to a level of 50% of its peak level; that is, 0.5 HPBW (half-power beam-width).
2. Sample selection
In the pre-release EBHIS data cubes (made from the first of the two passes), we visually searched the Galactic plane region (|b|< 6°) and extracted 170 H I detections of varying quality, a third of which had not been previously detected in H I (for details see Schröder et al. 2019a).
To select EZOA sources for follow-up H I observations with the NRT, we used the following criteria as a guide line, which resulted in a sample of 77 target sources:
-
A signal too weak for an accurate determination of the H I profile parameters and sky position (peak S/N ⪅ 10);
-
No previously published H I detection;
-
H I profiles affected by baseline variations, noise, or RFI;
-
Multiple optical or NIR counterparts or an uncertain counterpart.
In addition, we selected 22 EZOA candidate sources that were not published in the EZOA paper. Based on their appearance in the data cube, final integrated line profile, and the existence – or absence – of a reasonable stellar counterpart, they were judged to have a low likelihood of being real. The NRT follow-up observations of these will, on the one hand, serve to verify if the emission indeed comes from a galaxy and, on the other hand, allow for an assessment of our internal classification scheme.
Our final tally consists of 99 sources selected for follow-up observations. Multiple pointings per EZOA source were required for multiple potential counterparts of an EZOA source or, if no multi-wavelength cross-match could be identified, to cover the positional uncertainty area of the EZOA detection ( ) with the narrower NRT beam (with an east-west HPBW radius of
  , usually three pointings sufficed). This resulted in 143 NRT pointings for the 99 sources.
We also selected a few EZOA sources that fall within velocity ranges that are known to be polluted by strong RFI to apply and test the efficacy of our RFI mitigation software (Belleval 2019).
3. Observations and data reduction
The NRT is a 100 metre-class meridian transit-type instrument (see, e.g. van Driel et al. 2016 for further details on the instrument and data reduction). Due to the east-west elongated shape of the mirrors, the beam size and sensitivity depend on the observed declination. Its HPBW is always  in right ascension, independent of declination, whereas in declination it increases from 22′ for δ < 20° to 31′ at δ = 66°, the northern limit of our survey (see also Matthews & van Driel 2000). Its sensitivity follows the same geometric effect and decreases correspondingly with declination. The typical system temperature is 35 K at δ = 0°.
The flux calibration was determined through regular measurements of a cold load calibrator and periodic monitoring of strong continuum sources by the Nançay staff. For verification and monitoring of this standard calibration, we also regularly observed H I line flux calibrator galaxies measured at Arecibo by O’Neil (2004). From our 14 NRT measurements, we derived a ratio between our integrated line fluxes and the literature values of 1.01 ± 0.09.
All sources were observed with the standard auto-correlator (ACRT) using a set-up of 4096 channels in a 50 MHz bandpass, with a channel spacing of 2.6 km s−1 and a velocity coverage of ∼ − 250 to 10 600 km s−1. The data were taken in position-switching mode, with an on-source integration time of 40 seconds per on-off pair. The observations were made in the period January 2019 – March 2023, using a total of about 230 hours of telescope time.
We used standard NRT software to flag and mitigate strong RFI in the ACRT data (Monnier Ragaigne et al. 2003), average the two receiver polarisations, perform the declination-dependent conversion from system temperature to flux density in millijansky, fit polynomial baselines, smooth the data to a velocity resolution of 10 km s−1, and ultimately convert radial velocities to the optical, heliocentric cz system. The H I flux was determined by integrating over the entire velocity width of the detected profile.
Uncertainties in H I line parameters were determined following Koribalski et al. (2004); they depend, among others, on the S/N (ratio of the line peak flux density and the rms noise level) and the velocity resolution (10 km s−1). The integrated H I flux of galaxies of sufficiently large apparent diameter could in principle be underestimated with the NRT as its east-west HPBW of  is rather small. For example, at the mean velocity of the detected targets, 3800 km s−1, the NRT HPBW corresponds to a linear size of 40 kpc.
For the RFI mitigation tests, we observed the galaxies simultaneously with the standard ACRT and with the WIBAR high-resolution and high-sampling rate receiver. The WIBAR data were processed using the RObust Elusive Line detection (ROBEL) RFI mitigation software package (see Belleval 2019 for details on WIBAR and ROBEL). For comparison with ACRT data, the original WIBAR velocity resolution of 0.9 km s−1 was smoothed to 11.1 km s−1. However, due to receiver problems and the restrictive nature of the COVID-19 pandemic safety protocols, useful results could only be obtained for two of the 20 observed test sources.
4. Results
4.1. Observations
The results of our NRT follow-up observations are summarised in Table B.11, including a comparison to the EBHIS H I measurements. All observations were adjudicated based on the individual assessment of the spectra (S/N and the profile shape) by three authors. The resulting NRT spectra are shown in Fig. B.1.
Listed in Table B.1 are:
Col. 1: Identification (ID) of the EZOA source (without the EZOA prefix).
Col. 2: Classification of the H I detection. The EBHIS classification is given to the left of the arrow and the new, NRT, classification to the right. Class 1 indicates a clear detection; 3+, 3, and 3− are detections with varying degrees of confidence, with 3− denoting a possible detection (not listed in the EZOA catalogue); 4 marks a non-detection; and 5 indicates an inconclusive result.
Col. 3: Flag n refers to a note in Appendix A.
Col. 4: Equatorial co-ordinates (J2000.0) of the EBHIS detection.
Col. 5: EBHIS heliocentric velocity (cz) and uncertainty, in km s−1.
Col. 6: EBHIS velocity width at 50% of peak flux density and associated uncertainty, in km s−1.
Col. 7: EBHIS integrated H I flux and associated uncertainty, in Jy km s−1.
Col. 8: EBHIS peak S/N.
Col. 9: NRT pointing ID; a footnote lists the reference of a detection not observed by us.
Col. 10: NRT pointing position in equatorial (J2000.0) co-ordinates.
Col. 11: NRT pointing target classification: c = cross-match candidate, e = EBHIS position, s = NRT search position.
Col. 12: Distance between the NRT pointing position and the EBHIS source position, in units of the NRT beam radius, b.
Col. 13: Classification of the cross-match candidate (that is, for pointing target ‘c’, see Col. 11): ‘d’ = definite, ‘p’ = probable, ‘a’ = ambiguous, ‘c’ = contributor to a confused profile, ‘u’ = uncertain galaxy, ‘n’ = not a candidate. Where the classification has changed, the former EBHIS classification is given on the left and the new classification on the right, linked by an arrow.
Col. 14: Class of the NRT/EBHIS integrated flux ratio, cfl (see Col. 15): while cfl = 2 stands for comparable fluxes (that is, 0.9 ≤ Rfl ≤ 1.0; see also the discussion of Fig. 1), classes 1 and 3 indicate a higher and lower NRT flux, respectively; 4 means no NRT detection; and 5 indicates that the flux ratio is not usable, mainly when the profiles are not comparable (especially when the line width is significantly different, e.g. due to confusion, or when RFI affects the profile).
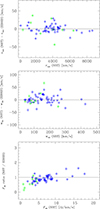 |
Fig. 1. Comparison of the EBHIS and NRT H I line parameters central velocity (top), the line width (middle), and integrated fluxes (bottom). Blue circles are pointings towards cross-matches and green circles are the best NRT pointings when no cross-match is visible (corresponding to NRT final flag 1). |
Col. 15: Ratio of NRT and EBHIS integrated fluxes, Rfl.
Col. 16: Final NRT flag: 0 = observed candidate is the stellar counterpart; 1 = pointing with the best detection (no cross-match candidate); 2 = candidate contributes to the EZOA detection (a plus denotes a major contributor, a minus a minor contribution); 3 = low-level detection, not the best pointing; 4 = not detected; 5 = inconclusive (e.g. due to RFI).
Col. 17: NRT spectrum rms noise level, in mJy.
Col. 18: NRT heliocentric velocity (cz) and uncertainty, in km s−1.
Col. 19: NRT velocity width at 50% of peak flux density and associated uncertainty, in km s−1.
Col. 20: NRT velocity width at 20% of peak flux density and associated uncertainty, in km s−1.
Col. 21: NRT integrated H I flux and associated uncertainty, in Jy km s−1.
Col. 22: NRT peak S/N.
4.2. Detections
Based on these observations, we determined the ‘best’ NRT pointing for a given EZOA source, most of which were towards an optical/NIR cross-match candidate that was thus confirmed. The decision was made based on the ratios of fluxes measured towards the various pointings of an EZOA source (and their spatial separations), profile shapes, and possible confusion with other sources. Where the identification was more complex, we give a note in Appendix A. In most cases, we were able to improve on the original EZOA S/N. Table B.22 lists the detection of the ‘best’ NRT pointing, giving the observed and derived parameters as well as information on the cross-match where one was identified. The columns are as follows.
Col. 1: ID of the EZOA source (without the EZOA prefix).
Col. 2: Classification of the NRT detection (see Table B.1, Col. 2).
Col. 3: Flag n refers to a note in Appendix A.
Col. 4: NRT pointing ID (see Table B.1).
Col. 5–9: NRT H I line parameters, from Table B.1, Cols. 18–22.
Col. 10: Radial velocity of the galaxy, in km s−1, corrected to the Local Group frame of reference using vLG = vhel + 300 sin ℓ cos b.
Col. 11: Distance to the galaxy based on vLG, in Mpc.
Col. 12: Logarithm of the total H I mass, in M⊙.
Col. 13: Final NRT flag (see Table B.1, Col. 16).
Col. 14: Final classification of the cross-match (see Table B.1).
Col. 15: Angular distance between NRT pointing and position of the optical/NIR cross-match (where they differ), in NRT beam radius units, b. Uncertainties in integrated flux and other H I parameters increase correspondingly. No corrections have been applied to the given parameters.
Col. 16: Equatorial (J2000.0) co-ordinates of the cross-match (where available) or of the best NRT pointing position.
Col. 17: Positional uncertainty: where the visible galaxy appears diffuse, without a clear centre, we added a colon (:) to indicate a larger positional uncertainty than is implied by the precision of the co-ordinates. Where no candidate is found, we give an improved positional uncertainty ellipse (with minor and major semi-axes in arcminutes).
Col. 18 and 19: Galactic longitude and latitude, in degrees.
Col. 20: Galactic extinction in the K band, derived from the extinction maps published by Planck Collaboration Int. XLVIII (2016) using the conversion AK = 0.36 ⋅ E(B − V) and a correction factor, f, of 0.86 (Schröder et al. 2021).
Col. 21: ID of the cross-match (see Table A.1 for all previously uncatalogued galaxies around the EZOA sources in our sample).
In addition to the detections of the EZOA sources, we also list serendipitous detections found in five of the NRT pointings. Their spectra are shown in Fig. B.2. For three of them, we found a cross-match.
4.3. Quality assessment of H I parameters
Figure 1 shows comparisons of the H I line parameters obtained with the NRT and EBHIS. We only used non-confused, confirmed EZOA sources with comparable profiles, resulting in 61 objects (excluding flux ratio class 5, see Col. 14 in Table B.1). Pointings with no cross-match are shown in green (i.e. detections with the final NRT flag 1). The mean NRT−EBHIS offsets for the central velocity (0.6 ± 1.7 km s−1) and line width, w50 (2.0 ± 2.4 km s−1), are negligible. The mean flux ratio of 0.88 ± 0.03 is slightly low.
Most outliers can be explained by the noisiness of their EBHIS profile (e.g. inclusion or exclusion of noise peaks at the edge of the profile), baseline variations (in either profile), or possible (low-level) confusion. For example, the latter two explanations are responsible for the high flux ratio of 1.6 for the bright EZOA sources EZOA J2050+47 and J0437+64 (FNRT ∼ 16 Jy km s−1), respectively. In one case (EZOA J0314+64), the EBHIS detection was found at the edge of the cube, losing part of the signal of its H I disc (Δv = −5 km s−1, Δw50 = −41 km s−1, FNRT/FEBHIS = 1.6). In another case (EZOA J0253+55), the H I disc is resolved in the NRT observation (Δv = 2 km s−1, Δw50 = −7 km s−1, FNRT/FEBHIS = 0.5). Where no cross-match is found (green circles), the galaxy may not be situated very close to the centre of the NRT beam, resulting in a lower detected flux. While this obviously influences the flux ratios (the mean improves to 0.92 ± 0.03 when green circles are excluded), it does not cause any significant deviations in velocity and line widths.
5. Discussion
5.1. Recovery rate
Our NRT target list contains both weaker and potential EZOA detections. The deeper NRT follow-up observations now allow for a better assessment of the various EZOA classifications. This will be very useful for future source detection efforts with EBHIS and other, similar surveys.
Table 1 gives the NRT recovery rate as a function of the EZOA source classification, which was based on the S/N, appearance in the spectral cube, form of the profile, and other information, like the proximity of RFI or baseline variations. Most of the detections selected for this follow-up study have a low S/N, and hence an intrinsically lower reliability. The recovery rates validate our internal classification scheme and show a clear offset between, on the one hand, solid and marginal EZOA detections (classes 1, 3+ and 3, in order of declining confidence levels) and, on the other, the lowest class, 3−, which indicates possible detections (not included in the published EZOA catalogue). The striking decrease from a recovery of 63% for class 3 to 18% for 3− confirms the classification scheme, including the label ‘possible’ for the lowest class detections.
NRT recovery rate of EZOA sources.
These recovery rates, however, should not be considered as final. The NRT target list only covered a subsample of all EZOA sources. The total recovery rate for the class 1 EZOA detections should be stable at 100%3. The rates of class 3+ and 3 sources increase if we include those we did not observe. Of the 40 class 3+ EZOA sources, 15 were not observed, since they had all previously been detected in H I. Including these raises the total recovery rate to 93%. Similarly for class 3: if we include the three sources we did not observe, the total recovery rate increases to 68%.
Further investigating the recovery rates, we checked the three sources with a class 3+ classification in EZOA that were not detected with the NRT: the two non-detections were indeed borderline class 3 cases. The third EZOA source, a firmer class 3+ detection, is inconclusive since three NRT pointings were affected by GPS RFI and one good observation had a high rms.
Regarding the class 3− sources, it is interesting to note that all four confirmed sources had been independently identified in EBHIS data by a neural network software package (Flöer 2015; see also the discussion in Schröder et al. 2019a). The package uses an automated source finding algorithm to detect candidate sources, then uses a neural network to classify these as detections or non-detections. The classification procedure had been improved by using the EZOA sources found by visual inspection of the H I cubes as well as a list of rejects from an older version of the neural network catalogue (Schröder et al. 2019a). This resulted in 15 new sources that had not been found visually, but only three of them were subsequently judged to be sufficiently strong and acceptable to be included in the class 3− list (the majority were too faint for making a decision during the visual inspection). Schröder et al. (2019a) give a detailed discussion on the completeness and reliability of this automated source catalogue, mentioning a 100% reliability of sources with S/N > 8, while the four confirmed sources have S/Ns in the range 5–7. In contrast, only one of the possible sources that had been found by eye4 was recovered by the NRT observations, indicating a higher reliability of machine learning classifications at the low S/N end.
It is also worth noting that secondary information, like the presence or absence of a (credible) cross-match5 is useful in estimating the reliability of an H I detection, with the caveat that at low S/Ns the flux, and with it the H I mass, have a higher uncertainty. To investigate this further, we separate the recovery rates into sources with and without a cross-match in Table 2. The differences are striking for class 3 and 3− sources. The numbers need to be taken with a grain of salt, however, because (a) we did not take into account whether a cross-match is expected to be visible or not (given the foreground extinction and star density at its location6), and (b) we are dealing with small-number statistics (less than ten in many cases). However, an H I detection with a cross-match is more likely to be reliable for all classes.
Recovery rate of EZOA sources with and without a cross-match.
5.2. New detections
Due to the higher sensitivity of the NRT observations and the large north-south extent of the NRT beam, we have found five serendipitous detections. They are listed at the end of Table B.2. For three of them, we could identify a cross-match. Only one of these (EZOA J0253+55B) has a previously known redshift (Kraan-Korteweg et al. 2018).
Adding these to the detections of the four formerly class 3− sources, we have nine detections in total that were not listed in the original EZOA catalogue. On the other hand, seven EZOA sources could not be confirmed and need to be removed from the catalogue. The top panel of Fig. 2 shows the on-sky distribution of all 170 EZOA sources (colour-coded by velocity; circles depict NRT observations) with the new NRT detections and non-detections indicated by green and red circles, respectively. The bottom panel shows the distribution of the updated EZOA catalogue sources together with velocity data available in the literature (through HyperLEDA). The EZOA detections clearly trace several large-scale structures across the gap of the ZoA (see Schröder et al. 2019a for a detailed discussion of these structures).
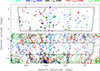 |
Fig. 2. On-sky distribution of H I detections in Galactic co-ordinates; the symbols are colour-coded as a function of radial velocity (see labels at the top). Top panel: original 170 EZOA catalogue galaxies (circles depict those re-observed with the NRT); NRT non-detections are encircled in red, the newly found NRT detections in green. Bottom panel: EZOA sources based on the updated list (crosses), combined with galaxies listed in HyperLEDA (dots). For a better assessment of the large-scale structures, we have increased the range in Galactic latitude. |
5.3. RFI mitigation test results
Our RFI mitigation procedure relies on the main assumption that time-line series of voltages recorded in the NRT receiver chain from non-variable cosmic sources have normal – that is, Gaussian – distributions, whereas any artificial (e.g. RFI) signal cannot have a Gaussian distribution, since it carries coherent information. The corresponding time-line series of power spectral values in each frequency channel have a χ2 distribution with two degrees of freedom. Thus, averaged power spectral values from N individual power spectra are χ2 distributed with 2N degrees of freedom. By virtue of the central limit theorem, for N ≳ 25 the χ2 distribution approaches a normal distribution. Therefore, we configured the WIBAR spectrometer in such a way that it produces time-line series of averaged power spectral values that fulfil the N ≳ 25 condition.
We regard RFI signals as statistical outliers, defined as points lying outside the bulk of the normal distribution in each frequency channel. To detect RFI, we compare non-robust estimators of location (EoLs), such as the mean, and of scale (EoSs), such as the standard deviation, to robust EoLs and EoSs that are immune to outliers. For the latter, we chose, respectively, the median as the EoL, and compared results obtained with the median absolute deviation (MAD) and its alternatives, Sn and Qn (see Rousseeuw & Croux 1993), as the EoS. To remove RFI, we applied a 5 × 3Sn recursive clipping process in each frequency channel, since we found Sn to provide the best compromise between efficiency and computing time for large samples (see Belleval 2019 for further details).
Results of our RFI mitigation test observations are shown here only for the two galaxies for which the test results add pertinent new information to the standard NRT ACRT and the EZOA data. The observations of the other test sources were marred by instrumental problems (cf. Sect. 3).
Figure 3 shows the results for the two sources, EZOA J2216+50 and J0047+57, which are discussed below. Spectra obtained with the WIBAR receiver before and after processing with the ROBEL RFI mitigation package are shown as grey and black lines, respectively. Also shown (in blue) are the standard ACRT auto-correlator spectra.
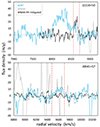 |
Fig. 3. Results of RFI mitigation test observations of two objects. Shown are standard Nançay ACRT auto-correlator H I line spectra (in blue) and spectra obtained with the WIBAR broadband receiver, both without RFI mitigation (in grey) and after RFI mitigation using the ROBEL software package (in black). Shown is flux density (in millijansky) as a function of heliocentric radial velocity in the optical framework, cz (in km s−1). The velocity resolution is 11.1 km s−1 for the WIBAR spectra, and 10.3 km s−1 for the standard ACRT spectra. The pairs of vertical dotted red lines indicate the profile widths of the EBHIS spectra. |
The WIBAR spectrum of EZOA J2216+50 after RFI mitigation (black lines) shows that the ACRT spectrum is dominated by residuals of broad GPS L3 RFI around 8200 km s−1. These unwanted emissions could be successfully mitigated in the WIBAR data to reveal a clear detection within the EZOA profile velocity range (dotted red lines). A comparison of the H I line parameters with the EBHIS parameters is given in Table 3. While the agreement in velocity and line width is very good, the flux is lower than expected since we observed here the EBHIS position (pointing B) instead of the actual cross-match at a 1.0b distance.
Comparison of line parameters in the RFI mitigation test for EZOA J2216+50.
For EZOA J0041+57, only narrow RFI signals are detected in the WIBAR spectrum (grey lines) within the EZOA profile velocity range, which could be mitigated (black line), resulting in an estimated rms noise level of 3.0 mJy (compared to 11.1 mJy in the EBHIS spectrum). This indicates that the reported EZOA detection was due to RFI signals, which is not unexpected, considering that EZOA J0047+57 was only a possible (class 3−) detection.
6. Summary
In this paper, we have presented follow-up 21 cm H I line observations made with the 100 m-class NRT of selected sources in the northern ZoA from the EZOA catalogue (Schröder et al. 2019a). These sources were extracted from the shallow, first-pass version of the EBHIS blind H I survey performed with the Effelsberg 100 m radio telescope (Kerp et al. 2011 and Winkel et al. 2010). Our selection criteria include low S/N (⪅10), no or an ambiguous optical or NIR counterpart, and noisy profiles, resulting in 77 EZOA sources. In addition, we included 22 candidate detections that were deemed too unreliable to be published in the EZOA paper.
While the rms noise level of the shallow survey EBHIS cubes is 23 mJy beam−1, the median rms level of the EZOA detections is 10.4 mJy beam−1 (Schröder et al. 2019a), and the NRT follow-up observations have an almost three times lower median rms level of 3.6 mJy beam−1. Of the 99 observed sources, we confirmed 72, while three yielded inconclusive results. Most of the non-detections (17 out of 24) were potential EZOA sources with a low reliability. In addition, due to the higher sensitivity of our NRT observations as well as the large north-south extent of the NRT beam, we have found five serendipitous detections.
We investigated how the EZOA classification scheme of the detections (based, among others, on the appearance in the spectral cube and the profile) correlates with the recovery rate. We find that the classification scheme is very effective, with a 100% recovery rate for definite detections, 93% and 68% for two sets of marginal detections, and only 18% for detections considered to have a low likelihood of being real. We also found that for potential detections, the presence or absence of a suitable cross-match candidate is a useful indicator of reliability.
Finally, we have updated the EZOA catalogue parameters for the 75 detected EZOA sources, removed the non-detections, and added the four confirmed EZOA candidate detections. The five serendipitous detections are listed separately.
Though only two sources yielded useful results, the RFI mitigation test observations proved useful. Unwanted emission due to RFI is successfully mitigated in both spectra, showing in one case a solid detection, while in the other case any previously noted emission can be attributed to RFI. In both cases, the rms noise is significantly reduced.
Data availability
Tables A.1, B.1, and B.2 are available at the CDS via anonymous ftp to cdsarc.cds.unistra.fr (130.79.128.5) or via https://cdsarc.cds.unistra.fr/viz-bin/cat/J/A+A/695/A79
Electronically available at the CDS; the table given in the appendix shows the first ten lines as an example.
Electronically available at the CDS; the table given in the appendix shows the first ten lines as an example.
Given the full recovery of all lower S/N detections, we can assume that all other class 1 detections are equally reliable.
Incidentally, it was also found by the improved neural network.
Taking into account extinction levels and star densities in the field in combination with the H I mass and line width of the detection, that is, do we expect to see this source?
To note, Staveley-Smith et al. (2016) give a discussion on the dependence of finding a cross-match with Galactic longitude, that is, closer to the bulge it becomes more difficult to find a cross-match due to higher extinctions and star densities.
Electronically available at the CDS; the table shown here gives the first ten lines as an example.
It was also observed by Masters et al. (2014), but we prefer a direct comparison of two NRT detections because of the NRT’s unusual beam form.
Acknowledgments
We want to thank Matt Lehnert for his help with the analysis of spectra. This research has made use of the Pan-STARRS1 Surveys public science archive and the HyperLeda database (http://leda.univ-lyon1.fr). The Nançay Radio Observatory is operated by the Paris Observatory, associated with the French Centre National de la Recherche Scientifique. RKK wishes to thank the South African NRF for their financial support.
References
- Belleval, C. 2019, PhD thesis, Paris Observatory [Google Scholar]
- Chamaraux, P., Cayatte, V., Balkowski, C., & Fontanelli, P. 1990, A&A, 229, 340 [NASA ADS] [Google Scholar]
- Courtois, H. M., Tully, R. B., Fisher, J. R., et al. 2009, AJ, 138, 1938 [Google Scholar]
- Donley, J. L., Staveley-Smith, L., Kraan-Korteweg, R. C., et al. 2005, AJ, 129, 220 [NASA ADS] [CrossRef] [Google Scholar]
- Dressler, A., Lynden-Bell, D., Burstein, D., et al. 1987, ApJ, 313, 42 [Google Scholar]
- Flöer, L. 2015, PhD thesis, University of Bonn [Google Scholar]
- Flöer, L., Winkel, B., & Kerp, J. 2014, A&A, 569, A101 [NASA ADS] [CrossRef] [EDP Sciences] [Google Scholar]
- Focardi, P., Marano, B., & Vettolani, G. 1984, A&A, 136, 178 [NASA ADS] [Google Scholar]
- Goedhart, S., Cotton, W. D., Camilo, F., et al. 2024, MNRAS, 531, 649 [CrossRef] [Google Scholar]
- Haynes, M. P., Giovanelli, R., et al. 2018, ApJ, 861, 49 [NASA ADS] [CrossRef] [Google Scholar]
- Henning, P. A., Kraan-Korteweg, R. C., Rivers, A. J., et al. 1998, AJ, 115, 584 [CrossRef] [Google Scholar]
- Henning, P. A., Springob, C. M., Day, F., et al. 2008, in The Evolution of Galaxies Through the Neutral Hydrogen Window, eds. R. Minchin, & E. Momjian, AIP Conf. Ser., 1035, 246 [NASA ADS] [CrossRef] [Google Scholar]
- Huchra, J. P., Macri, L. M., Masters, K. L., et al. 2012, ApJS, 199, 26 [Google Scholar]
- Hudson, M. J., Smith, R. J., Lucey, J. R., & Branchini, E. 2004, MNRAS, 352, 61 [Google Scholar]
- Kerp, J., Winkel, B., Ben Bekhti, N., Flöer, L., & Kalberla, P. M. W. 2011, Astronomische Nachrichten, 332, 637 [NASA ADS] [CrossRef] [Google Scholar]
- Koribalski, B. S., Staveley-Smith, L., Kilborn, V. A., et al. 2004, AJ, 128, 16 [Google Scholar]
- Kraan-Korteweg, R. C., Woudt, P. A., Cayatte, V., et al. 1996, Nature, 379, 519 [NASA ADS] [CrossRef] [Google Scholar]
- Kraan-Korteweg, R. C., Henning, P. A., & Schröder, A. C. 2002, A&A, 391, 887 [NASA ADS] [CrossRef] [EDP Sciences] [Google Scholar]
- Kraan-Korteweg, R. C., Cluver, M. E., Bilicki, M., et al. 2017, MNRAS, 466, L29 [NASA ADS] [CrossRef] [Google Scholar]
- Kraan-Korteweg, R. C., van Driel, W., Schröder, A. C., Ramatsoku, M., & Henning, P. A. 2018, MNRAS, 481, 1262 [Google Scholar]
- Kurapati, S., Kraan-Korteweg, R. C., Pisano, D. J., et al. 2024, MNRAS, 528, 542 [NASA ADS] [CrossRef] [Google Scholar]
- Lang, R. H., Boyce, P. J., Kilborn, V. A., et al. 2003, VizieR Online Data Catalog: J/MNRAS/342/738 [Google Scholar]
- Louw, A., Kurapati, S., Pisano, D. J., & Kraan-Korteweg, R. 2024, IAU General Assembly, 1043 [Google Scholar]
- Macri, L. M., Kraan-Korteweg, R. C., Lambert, T., et al. 2019, ApJS, 245, 6 [Google Scholar]
- Masters, K. L., Crook, A., Hong, T., et al. 2014, MNRAS, 443, 1044 [NASA ADS] [CrossRef] [Google Scholar]
- Matthews, L. D., & van Driel, W. 2000, A&AS, 143, 421 [NASA ADS] [CrossRef] [EDP Sciences] [Google Scholar]
- McIntyre, T. P., Henning, P. A., Minchin, R. F., Momjian, E., & Butcher, Z. 2015, AJ, 150, 28 [NASA ADS] [CrossRef] [Google Scholar]
- Meyer, M. J., Zwaan, M. A., Webster, R. L., et al. 2004, MNRAS, 350, 1195 [Google Scholar]
- Monnier Ragaigne, D., van Driel, W., Schneider, S. E., Balkowski, C., & Jarrett, T. H. 2003, A&A, 408, 465 [NASA ADS] [CrossRef] [EDP Sciences] [Google Scholar]
- O’Neil, K. 2004, AJ, 128, 2080 [CrossRef] [Google Scholar]
- Paturel, G., Theureau, G., Bottinelli, L., et al. 2003, A&A, 412, 57 [NASA ADS] [CrossRef] [EDP Sciences] [Google Scholar]
- Planck Collaboration Int. XLVIII. 2016, A&A, 596, A109 [NASA ADS] [CrossRef] [EDP Sciences] [Google Scholar]
- Rajohnson, S. H. A., Kraan-Korteweg, R. C., Chen, H., et al. 2024, MNRAS, 531, 3486 [NASA ADS] [CrossRef] [Google Scholar]
- Ramatsoku, M., Verheijen, M. A. W., Kraan-Korteweg, R. C., et al. 2016, MNRAS, 460, 923 [NASA ADS] [CrossRef] [Google Scholar]
- Rivers, A. J., Henning, P. A., & Kraan-Korteweg, R. C. 1999, PASA, 16, 48 [NASA ADS] [CrossRef] [Google Scholar]
- Rousseeuw, P. J., & Croux, C. 1993, Journal of the American Statistical Association, 88, 1273 [CrossRef] [Google Scholar]
- Said, K., Kraan-Korteweg, R. C., Staveley-Smith, L., et al. 2016, MNRAS, 457, 2366 [NASA ADS] [CrossRef] [Google Scholar]
- Sanchez-Barrantes, M., Henning, P. A., McIntyre, T., et al. 2019, AJ, 158, 234 [NASA ADS] [CrossRef] [Google Scholar]
- Schröder, A. C., Kraan-Korteweg, R. C., & Henning, P. A. 2009, A&A, 505, 1049 [NASA ADS] [CrossRef] [EDP Sciences] [Google Scholar]
- Schröder, A. C., Flöer, L., Winkel, B., & Kerp, J. 2019a, MNRAS, 489, 2907 [Google Scholar]
- Schröder, A. C., van Driel, W., & Kraan-Korteweg, R. C. 2019b, MNRAS, 482, 5167 [Google Scholar]
- Schröder, A. C., van Driel, W., & Kraan-Korteweg, R. C. 2021, MNRAS, 503, 5351 [CrossRef] [Google Scholar]
- Springob, C. M., Haynes, M. P., Giovanelli, R., & Kent, B. R. 2005, ApJS, 160, 149 [NASA ADS] [CrossRef] [Google Scholar]
- Springob, C. M., Hong, T., Staveley-Smith, L., et al. 2016, MNRAS, 456, 1886 [CrossRef] [Google Scholar]
- Staveley-Smith, L., Kraan-Korteweg, R. C., Schröder, A. C., et al. 2016, AJ, 151, 52 [Google Scholar]
- Steyn, N., Kraan-Korteweg, R. C., Rajohnson, S. H. A., et al. 2024, MNRAS, 529, L88 [Google Scholar]
- Tully, R. B., Shaya, E. J., Karachentsev, I. D., et al. 2008, ApJ, 676, 184 [Google Scholar]
- Tully, R. B., Pomarède, D., Graziani, R., et al. 2019, ApJ, 880, 24 [Google Scholar]
- van Driel, W., Butcher, Z., Schneider, S., et al. 2016, A&A, 595, A118 [NASA ADS] [CrossRef] [EDP Sciences] [Google Scholar]
- van Driel, W., Schneider, S. E., Kraan-Korteweg, R. C., & Monnier Ragaigne, D. 2009, A&A, 505, 29 [NASA ADS] [CrossRef] [EDP Sciences] [Google Scholar]
- Winkel, B., Kalberla, P. M. W., Kerp, J., & Flöer, L. 2010, ApJS, 188, 488 [NASA ADS] [CrossRef] [Google Scholar]
- Wong, O. I., Ryan-Weber, E. V., Garcia-Appadoo, D. A., et al. 2006, MNRAS, 371, 1855 [Google Scholar]
- Woudt, P. A., Kraan-Korteweg, R. C., Cayatte, V., Balkowski, C., & Felenbok, P. 2004, A&A, 415, 9 [NASA ADS] [CrossRef] [EDP Sciences] [Google Scholar]
Appendix A: Notes on individual galaxies
In the following we discuss individual cases where the H I line emission shows a complex profile or its origin is ambiguous. When discussing possible contamination of a profile by a source close to the target, we often prefer to express angular distances in units of the NRT beam radius b to better understand relative parameters like flux ratios.
Uncatalogued galaxies around EZOA sources and previously catalogued galaxies with improved positions (example, the full table is available electronically at CDS).
To help with identifying potential cross-matches, we have compiled Table A.17 with uncatalogued galaxies around those EZOA detections that we have observed at the NRT (and being large enough to be relevant for our discussion). These were found while examining multi-wavelength images in the search for cross-matches (see Schröder et al. 2019a). We usually only list galaxies within the EZOA position uncertainty radius of  , though in cases of suspected in-beam confusion also galaxies further away are listed. Furthermore, we list previously catalogued galaxies where we improved the position, since these are important for our discussion. We note that all previously published galaxies near EZOA detections that are not listed in this table can be found in the CDS Simbad and NED databases. The columns are (1) EZOA ID (without the prefix); (2) galaxy ID (previously uncatalogued galaxies are given J2000.0-co-ordinate IDs); (3) equatorial (J2000.0) co-ordinates, with an uncertainty flag in Col. 4 if the centre of the galaxy could not easily be determined; (5) angular distance from the nominal EZOA position in arcminutes (for comparison, the EZOA position uncertainty is
  ); and (6) a comment where necessary.
J1856−03: There is a possible galaxy faintly visible in deep NIR images at (RA,Dec)  at a distance of
  from the EZOA position. Its large and diffuse appearance matches the profile well. The NRT observation of this position shows an improved profile with even peaks and a high flux ratio of 1.2, which seems to confirm this candidate.
J1921+14: The possible cross-match candidate has been confirmed.
J2001+26: There are three galaxies in the field, one of which (2MASX J20010969+2655338) was observed by Kraan-Korteweg et al. (2018) with the NRT but not detected. We observed now the other two and can confirm the one closer to the EZOA position (pointing A) as the cross-match.
J2102+46: The possible cross-match candidate has been confirmed.
J2125+48: There is no cross-match for this marginal (S/N =5.2) EZOA detection. We observed it with four pointings. We have possible detections at RA 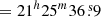 (pointing A) and RA
  (pointing D), albeit with less than the expected flux and showing only the lower velocity horn. However, the baseline of all observations is affected by GPS residuals, the rms is high (between 4 and 7) and the S/N is low (around 3). Ideally we need more observations to improve the S/Ns, but for the time being we assume that the detection is only a possible one and might not be real.
J2131+43: We observed the most likely cross-match (pointing A) and obtained a clearly confused profile, about twice as wide as the EBHIS profile. To the south, at a distance of  from the EZOA position (and 0.6b from our pointing A), is a tight group of galaxies (2MASX J21312321+4336182) that was observed by Paturel et al. (2003), listed in our table as pointing B8. The flux at pointing A is marginally higher than at pointing B, and also pointing A’s peak flux is about 10 mJy higher. We conclude that most of the EZOA detection comes from our cross-match at (RA,Dec)
  . 2MASX J21312321+4336182 likely contributes, and its low-velocity part is, in fact, visible in the EBHIS spectrum, though it is strongly affected by baseline variations.
J2216+50: We observed both the cross-match position (pointing A) and the EZOA position (pointing B). Both are affected by RFI. We could confirm the cross-match, but the measured flux is unreliable due to insufficient RFI subtraction. Pointing B was also observed with the WIBAR receiver to test the RFI mitigation software, resulting in a clearer profile (Sect. 5.3). However, the pointing is 1.0b from the cross-match position, resulting in a flux ratio of 0.4 as compared to the uncertain flux ratio of 0.7 found for pointing A.
J2230+51: This possible EZOA detection was not detected in the pointings towards two possible cross-match candidates. However, we have a serendipitous detection at v = 5806 km s−1, which is like due to the targeted cross-match candidate (pointing A).
J2237+53: The cross-match is a galaxy pair (2MASX J22370662+5357049 is nearly edge on, while 2MASX J22370933+5358339 is fairly inclined), both of which contribute to the H I detection. We observed the former, while the latter (at 0.25b) was observed previously both with the NRT (Paturel et al. 2003) and the Green Bank 300-foot telescope (GBT; Courtois et al. 2009); we have added them to our table for comparison. Our NRT observation shows a clear peak at v < 5100 km s−1, which is not obvious in the EBHIS profile. Comparing the two NRT profiles we can tell by the relative peak heights that the profile at 5100 < v < 5400 km s−1 comes from J22370662+5357049, while J22370933+5358339 covers 5200 < v < 5550 km s−1. Thus the EZOA detection comes mainly from J22370933+5358339. Note that Paturel et al. (2003) only measure the profile from v > 5200 km s−1 (same as the EBHIS profile), while Courtois et al. (2009) give parameters for the full profile.
J2329+61: There is no obvious cross-match for this detection. We observed the EZOA position (pointing A) as well as positions about 1b ( ) to the west (pointing B) and east (pointing C), respectively, to cover the EBHIS positional uncertainty area. Only pointing A at the EZOA position shows a marginal detection, confirming the EZOA detection, but with a much lower flux (note, though, that the EBHIS profile has a low S/N of 4.8). The cross-match is likely found north or south of the EZOA position at a larger distance.
J0041+57: The NRT spectrum looks like a bona fide detection at v = 9547 km s−1, but it lies within a velocity range where RFI occurs frequently. Simultaneous observation with the WIBAR receiver and subsequent RFI mitigation shows that the apparent profile is entirely due to RFI (see Sect. 5.3).
J0112+63: We observed this marginal EZOA detection, which that has no cross-match, with three pointings, covering the EBHIS positional uncertainty area. The profile is marginal at pointing A and stronger at pointing B though the flux is still lower than the EBHIS value (∼50%). The profile shape appears less lopsided than in the EBHIS detection, which agrees with the cross-match lying closer to position B. We decided to re-investigate NIR images of this area and found that at (RA,Dec)  the DSS2-I and 2MASS-K band images show a diffuse patch which could be a low surface brightness galaxy (this agrees with the high extinction of
  ). Pan-STARRS1 images confirm this to be a galaxy. It is 0.8b west of pointing B, which agrees with the measured flux ratio of 0.5.
Pointing A also shows a serendipitous detection at v = 7503 km s−1, for which no cross-match is visible either.
J0125+64: There is no cross-match for this detection. Our detection at the EZOA position has about half the EBHIS flux (∼50%). We conclude that the cross-match lies either east or west, near the edge of the NRT beam.
J0141+63: Without a possible cross-match we observed the EZOA position for this possible EBHIS detection. We detect a marginal profile, albeit with a ∼30% lower flux. We also tried to observe a galaxy visible with WISE (pointing B) but the observation failed. Due to the low NRT flux (though both detections have a low S/N), we expect that the cross-match is likely nearer the edges of the NRT and EBHIS beams (more likely in the east-west direction).
J0147+63: There is no obvious cross-match for this detection. We observed the EZOA position (pointing A) as well as a position at RA =01h47m33s about 1.4b to the east (pointing B). Further southeast,  (or 2.4b) away, lies 2MASX J01474890+6305128, which was previously observed and detected by us (see Kraan-Korteweg et al. 2018) and is listed as pointing C in Table B.1 for convenience. All three observations show a detection, albeit with varying profile shapes. We conclude that the EBHIS detection is likely a confused profile with an invisible galaxy close to the EZOA position as the main contributor and 2MASX J01474890+6305128 as the confusing partner (contributing mainly at the high velocity end of the profile).
We also found a serendipitous detection at v = 7515 km s−1 in pointing A, but no candidate for it.
J0213+66: Schröder et al. (2019a) reported two galaxies in the field without being able to tell which could be the cross-match. We observed both and find that the galaxy at (RA,Dec)  (pointing B) is the cross-match. We have also detected the other galaxy at (RA,Dec)
  as a weak, low-velocity shoulder at v ≳ 4020 km s−1, which is not visible in the EBHIS spectrum. This indicates that the two galaxies could form a pair.
J0233+58: We confirm the cross-match with 2MASX J02333595+5836438 but also report emission at the high-velocity end of the profile, v ≲ 4720 km s−1, which is not visible in the EBHIS spectrum. It may come from a companion galaxy, 2MASX J02334017+5836388.
J0252+62: As the cross-match 2MASX J02520392+6235505 lies at a large distance from the EZOA position ( north), it is likely that another galaxy contributes to the profile. We observed both the cross-match and a galaxy about 0.9b to the South of it (and
  south of the EZOA position), visible on DSS and WISE images. For comparison, we also observed the EZOA position (pointing C). We find that at both galaxy positions the flux is slightly higher than at the EZOA position. We conclude that both cross-matches contribute to the EBHIS detection.
J0253+55: The NRT/EBHIS flux ratio at the probable cross-match candidate position (pointing A) is low at 0.5, though it should be noted that the EBHIS profile is noisy with an rms of 14 mJy. When we observed the EZOA position (pointing B), we found an even lower flux ratio of 0.3. This indicates that the cross-match is either the observed candidate or an invisible galaxy close to it.
Furthermore, a galaxy pair at  from the EZOA position had been observed previously by us with the NRT (Kraan-Korteweg et al. 2018): 2MASX J02531475+5528143 and 2MASX J02531969+5529140 are also listed in the table as pointing C and D, respectively. The pair was detected at v = 4462 km s−1 and 4337 km s−1, respectively, with fluxes too low for detection in the EBHIS survey (though the former is also visible in our spectrum of pointing A). However, both observations also show the EZOA detection at v = 3809 km s−1 albeit at a lower flux. Kraan-Korteweg et al. (2018) also observed a third, uncatalogued galaxy further north (pointing E). The separations between the EZOA cross-match candidate and these three galaxies are 1.0b, 1.4b and 1.1b, respectively, and all three show only the higher velocity peak at v ∼ 3820 km s−1, while our observation of the candidate shows a narrow double horn with a second (slightly higher) peak at v ∼ 3700 km s−1, which, in turn, is the main peak in pointing B.
We conclude that the cross-match has a large (resolved) H I disc, whose lower-velocity end lies close to the EZOA position while the high-velocity end points towards the galaxy pair. This would also explain the overall lower fluxes measured at the NRT.
J0308+64: This EZOA detection is of a local dwarf galaxy (at a distance of 9.8 Mpc; Schröder et al. 2019a) without a stellar counterpart listed. We observed the EZOA position and detected a strong signal at a slightly lower flux (70%). The fact that the NRT profile shows two peaks of equal height indicates that the galaxy must lie well within the telescope beam. We subsequently searched Pan-STARRS1 images and found a diffuse galaxy only  from the EZOA position, which, indeed, is also visible (though not recognisable as a galaxy) on DSS2-R, at (RA,Dec)
  .
.
J0314+64: Since the EZOA detection is located at the edge of the EBHIS cube, its profile is noisy and its position and H I parameters are uncertain. Our observation of the cross-match 2MASX J03151297+6452348 shows a profile which is ∼80 km s−1 wider than could be estimated from the noisy EBHIS profile.
J0324+60: The search for a cross-match revealed a diffuse patch on the DSS2-R image that could be a late-type dwarf galaxy but was too uncertain to be listed as cross-match in Schröder et al. (2019a). We observed this position with a flux ratio of 0.7. Though the flux is slightly lower than expected, we can confirm the cross-match since we also noted an elongated, diffuse low surface brightness (LSB) galaxy on Pan-STARRS1 images. At a distance of 18.3 Mpc we can assume that the H I disc is resolved by the NRT beam, which explains the lower flux.
J0328+53 and J0328+53B: EZOA J0328+53 (v = 8538 km s−1) is a noisy EBHIS detection with a double horned profile, and EZOA J0328+53B (v = 11 952 km s−1) is a possible single-peak detection. The two detections are separated by  . There is one possible cross-match candidate visible to the south (at 1.1b and 0.5b from the two EZOA source positions, respectively), which we observed (both pointings A) along with the EZOA J0328+53 position (pointings B). Pointing A is affected by RFI in the velocity range 8500 − 9500 km s−1 and is therefore inconclusive regarding the EZOA J0328+53 detection, while EZOA J0328+53B is clearly not detected. Pointing B shows baseline variations in the range 8000 − 9000 km s−1 and no recognisable H I profile, nor does it show a detection for EZOA J0328+53B.
J0332+58: Schröder et al. (2019a) mention a possible galaxy at (RA,Dec)  , which could be the cross-match. Our observation of this position (pointing A) shows a detection, but with too low a flux (60%). We also observed the EZOA position (pointing B), which shows a much stronger profile. The NRT/EBHIS flux ratio at pointing B is 0.9, indicating that the actual cross-match is very close to the B position. We thus give a new positional uncertainty for the EZOA detection with
  in RA and
  in Dec (referring to the inner ten percent of the NRT beam).
J0349+53: This marginal, single-peak EZOA detection is confirmed (pointing A) with an NRT/EBHIS flux ratio of 0.5, which implies that the cross-match lies near the edge of the NRT beam in the east-west direction.
J0358+47: The NRT profile at the position of the cross-match ZOAG G152.52-04.48 shows a sloped high-velocity shoulder (at v ≲ 5700 km s−1). To check if this could be due to confusion, we also observed a galaxy at 0.4b. This profile, though, shows both a lower shoulder and a lower total flux, and we therefore exclude confusion.
J0431+45: Though this was considered a firm, although weak and noisy, detection by Schröder et al. (2019a), we could not confirm it with three pointings covering the EBHIS positional uncertainty area.
J0433+39: We observed the cross-match of this possible EZOA source,  from the EZOA position. We detect a strong double horn profile with equal peaks but with a lower flux (60%). The very noisy EBHIS profile is about twice as wide as the NRT profile but seems to include a noise peak, which would explain the lower flux in our NRT detection.
J0437+43: Schröder et al. (2019a) give a galaxy pair as cross-match. We observed the northern component (2MASX J04370228+4356359; pointing A) but were not able to observe the eastern one (2MASX J04370607+4355349, a more inclined, earlier type spiral). The two galaxies are only 0.4b apart. The NRT profile looks clearly confused and wider than the EBHIS profile, which is quite noisy and, basically, shows only the two highest peaks. The galaxy was also observed by Springob et al. (2005) with the GBT. Their profile is heavily smoothed and shows few features, but it is obvious that is shows emission at higher velocities than our NRT profile (at v ≲ 4100 km s−1). Since the east-west GBT HPBW is larger than the NRT’s by a factor of about three, we assume that they have detected more flux from the companion galaxy, whose disc is oriented in an east-west direction, and that the NRT beam therefore would not see all of it. We conclude that both galaxies are detected, with the emission at the higher velocity end of the profile coming from 2MASX J04370607+4355349.
J0437+54: We observed a pair of galaxies: 2MASX J04373506+5414339 (pointing A) is fairly face-on, at vopt = 5369 km s−1 (Huchra et al. 2012) and is considered the probable EZOA cross-match, while 2MASX J04374087+5415389 (pointing B) is almost edge-on, at vopt = 5653 km s−1 (Huchra et al. 2012). Our NRT observations show an overall stronger profile for the former, while the profile of pointing B is weaker and seems to have a high-velocity shoulder. We conclude that both galaxies are detected but only 2MASX J04373506+5414339 contributes to the noisy EBHIS profile.
J0438+44: Schröder et al. (2019a) noted the close-by galaxy UGC 3108 at d =  from the EZOA position but excluded its contribution to the signal. We observed the adopted cross-match 2MASX J04381402+4407596 (1.5b from UGC 3108) and confirm the EZOA detection. UGC 3108 was observed by Springob et al. (2005) with the GBT, where it shows a wider profile starting at v < 3800 km s−1 (listed in our table as pointing B). The GBT profile shows our detection as a pronounced high velocity horn at v = 4000 − 4100 km s−1. Although we cannot exclude that the EBHIS and NRT observations both see part of the H I disc of UGC 3108, the contribution from our cross-match is clearly dominating.
J0446+44: We observed the EZOA position since there is no cross-match. The detected signal shows an NRT/EZOA flux ratio of 1.1 and the profile shows symmetric peaks. We conclude that the cross-match is well within the NRT beam, that is, very close to the EZOA position. We thus give a new positional uncertainty for the EZOA detection with  in RA and
  in Dec (referring to the inner ten percent of the NRT beam).
J0455+34: The possible cross-match candidate has been confirmed.
J0457+39: The NRT observation at the position of this possible EZOA detection shows a 3σ detection with only 10% of the EBHIS flux recovered. The two pointings east and west of the EZOA position show no detection at all. It is possible that the cross-match lies further north or south (note, though, that the north-south NRT HPBW of 22′ is twice that of EBHIS), or the detection may be spurious. More observations are needed to confirm this weak signal.
J0546+31: Apart from the cross-match 2MASX J05462224+3155264, there are several smaller, uncatalogued, galaxies visible on the images, possibly forming a galaxy group. We observed the three most prominent ones and can confirm that 2MASX J05462224+3155264 (pointing A) is indeed the cross-match. We also detect at least one of the smaller ones (pointing C, with a prominent peak at v = 7600 km s−1), and cannot exclude low level contamination of the NRT detections by one or more of the others. The EBHIS parameters are likely unaffected due to the lower sensitivity.
J0548+19: The cross-match is a close galaxy pair, 2MASX J05485392+1911467. We observed the main component (pointing A, an inclined large spiral), which shows a clearly confused profile, possibly due to the smaller companion, an earlier type spiral at  . The EBHIS detection does not show confusion, but it is very weak, and the sloped low-velocity shoulder (v ≲ 5700 km s−1) seen with the NRT is likely lost in the noise. There is also a large galaxy far to the south-east (2MASX J05490625+1904314; at 1.6b), which we observed (pointing B) to exclude the possibility that the elongated NRT beam might have picked up emission from it. Although this spectrum shows a detection, it is too weak to account for the strong low-velocity shoulder visible in pointing A. Instead, this is likely an off-beam detection of our galaxy pair.
J0636+00: Deep NIR images reveal the cross-match to be a galaxy triplet: pointing A targets 2MASX J06362668+0055433, which consists of an inclined spiral galaxy and a peculiar-looking companion (fragmented, or possibly a tight group of small – or distant – galaxies), while pointing B ( to the west) 2MASX J06362361+0055513 appears more face-on. The observed H I fluxes are about the same. Since the two pointings are separated by 0.4b, we would expect a notable difference between the two fluxes if only one source were detected. We therefore conclude that both (or all three) galaxies are detected by both the NRT and EBHIS.
J0649+09: The most likely cross-match is 2MASX J06493148+0939437 at a rather large distance of d =  from the EZOA position. We observed this galaxy (pointing A), but the detection is dominated by a strong OFF-position detection (from about 20′ east). Near that position lies UGC 3565, which was detected by Springob et al. (2005) with the Arecibo telescope in the velocity range ∼7250 − 7600 km s−1. This implies that half of our profile is affected by it, and only the NRT peak at v ∼ 7620 km s−1 lies just outside the profile of UGC 3565. We also observed four other galaxies in the area (see Fig. A.1).
The peak at v ∼ 7620 km s−1 is fainter for pointing C and appears of similar strength in pointings A and D (2MASX J06492673+0937525) though both are likely diminished (in different proportions) by the OFF-position profile. On the other hand, the two easterly pointings, B and E, are unaffected by the OFF-detection. They show detections in the range v = 7300 − 7600 km s−1 where the profile at v = 7500 − 7600 km s−1 is slightly stronger in pointing E and the emission at v = 7300 − 7500 km s−1 is likely due to the target of pointing B.
We conclude that the galaxies at pointing B and E are both detected in the velocity range v = 7300 − 7600 km s−1. Based on the spectra, we cannot distinguish whether one or both of the 2MASX galaxies has emission at v ≲ 7620 km s−1. However, 2MASX J06493148+0939437 at pointing A is more likely to be a strong H I detection since it is closer to both the EZOA position and the nearby HIZOA detection (Donley et al. 2005). The latter shows a likely confused profile with a peak at v ∼ 7550 km s−1, which we do not see in any of the NRT profiles due to the OFF-position detection. The galaxy at pointing C does not seem to have any emission in the velocity range. As to the EBHIS detection, it does not appear confused but the profile is noisy and its S/N of 5.4 is low. The EBHIS profile starts at v = 7350 km s−1, which means the galaxy at pointing B contributes only little, and most of the emission seems to come from 2MASX J06493148+0939437.
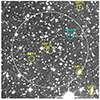 |
Fig. A.1. R-band 10′×10′ image of EZOA J0649+09. Labelled are the EZOA detection and positional uncertainty circle (white), the HIZOA detection (cyan) and the five NRT pointings (yellow). |
J0652−03: This marginal EZOA detection could not be confirmed. The ATNF HIZOA data archive9 shows a similar peak, which contributed to its inclusion into the EZOA catalogue. However, none of the three NRT pointings show any indication of a detection (the peak flux density should be around 100 mJy): pointing A is the most likely cross-match, pointing B is the EZOA position, and pointing C was set at a search position between these two to form a continuous coverage of this area with the NRT beams.
J0702−03: This detection was also found by Staveley-Smith et al. (2016) as HIZOA J0702−03B at (RA,Dec)  , about
  north of the EZOA position. There are two small cross-match candidates about 0.6b to the west. We observed the northern, more likely one (pointing A) as well as the EZOA position (pointing B). The flux ratio at pointing A is 0.9, as opposed to 0.6 at the EZOA position. We can thus confirm that the cross-match lies close to pointing A, though both candidates appear too small for a galaxy at a radial distance of ∼32 Mpc and an H I mass of log(MHI/M⊙) = 9.1. To note, there is a bright star close by, which could prevent us from seeing a possible LSB disk or from finding the cross-match.
Appendix B: Observation table and H I spectra
H I observations of EZOA sources (example, the full table is available electronically at CDS).
NRT detections of EZOA galaxies (example, the full table is available electronically at CDS).
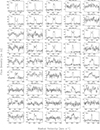 |
Fig. B.1. NRT 21cm H I line spectra of EZOA source observations. The velocity resolution is 10 km s−1. The pointing ID (see Table B.1) is indicated for each spectrum. To help the comparison with the EBHIS detections, the dashed vertical lines in each spectrum indicate the velocity range of the EBHIS detection, which was excluded in the EBHIS baseline fit. |
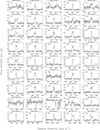 |
Fig. B.2. NRT 21cm H I line spectra – continued. |
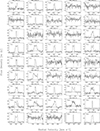 |
Fig. B.3. NRT 21cm H I line spectra – continued. |
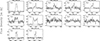 |
Fig. B.4. NRT 21cm H I line spectra – continued. |
All Tables
Uncatalogued galaxies around EZOA sources and previously catalogued galaxies with improved positions (example, the full table is available electronically at CDS).
H I observations of EZOA sources (example, the full table is available electronically at CDS).
NRT detections of EZOA galaxies (example, the full table is available electronically at CDS).
All Figures
|
Fig. 1. Comparison of the EBHIS and NRT H I line parameters central velocity (top), the line width (middle), and integrated fluxes (bottom). Blue circles are pointings towards cross-matches and green circles are the best NRT pointings when no cross-match is visible (corresponding to NRT final flag 1). |
| In the text | |
|
Fig. 2. On-sky distribution of H I detections in Galactic co-ordinates; the symbols are colour-coded as a function of radial velocity (see labels at the top). Top panel: original 170 EZOA catalogue galaxies (circles depict those re-observed with the NRT); NRT non-detections are encircled in red, the newly found NRT detections in green. Bottom panel: EZOA sources based on the updated list (crosses), combined with galaxies listed in HyperLEDA (dots). For a better assessment of the large-scale structures, we have increased the range in Galactic latitude. |
| In the text | |
|
Fig. 3. Results of RFI mitigation test observations of two objects. Shown are standard Nançay ACRT auto-correlator H I line spectra (in blue) and spectra obtained with the WIBAR broadband receiver, both without RFI mitigation (in grey) and after RFI mitigation using the ROBEL software package (in black). Shown is flux density (in millijansky) as a function of heliocentric radial velocity in the optical framework, cz (in km s−1). The velocity resolution is 11.1 km s−1 for the WIBAR spectra, and 10.3 km s−1 for the standard ACRT spectra. The pairs of vertical dotted red lines indicate the profile widths of the EBHIS spectra. |
| In the text | |
|
Fig. A.1. R-band 10′×10′ image of EZOA J0649+09. Labelled are the EZOA detection and positional uncertainty circle (white), the HIZOA detection (cyan) and the five NRT pointings (yellow). |
| In the text | |
|
Fig. B.1. NRT 21cm H I line spectra of EZOA source observations. The velocity resolution is 10 km s−1. The pointing ID (see Table B.1) is indicated for each spectrum. To help the comparison with the EBHIS detections, the dashed vertical lines in each spectrum indicate the velocity range of the EBHIS detection, which was excluded in the EBHIS baseline fit. |
| In the text | |
|
Fig. B.2. NRT 21cm H I line spectra – continued. |
| In the text | |
|
Fig. B.3. NRT 21cm H I line spectra – continued. |
| In the text | |
|
Fig. B.4. NRT 21cm H I line spectra – continued. |
| In the text | |
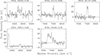 |
Fig. B.5. Same as Fig. B.1 for serendipitous detections in the telescope beam. |
| In the text | |
Current usage metrics show cumulative count of Article Views (full-text article views including HTML views, PDF and ePub downloads, according to the available data) and Abstracts Views on Vision4Press platform.
Data correspond to usage on the plateform after 2015. The current usage metrics is available 48-96 hours after online publication and is updated daily on week days.
Initial download of the metrics may take a while.