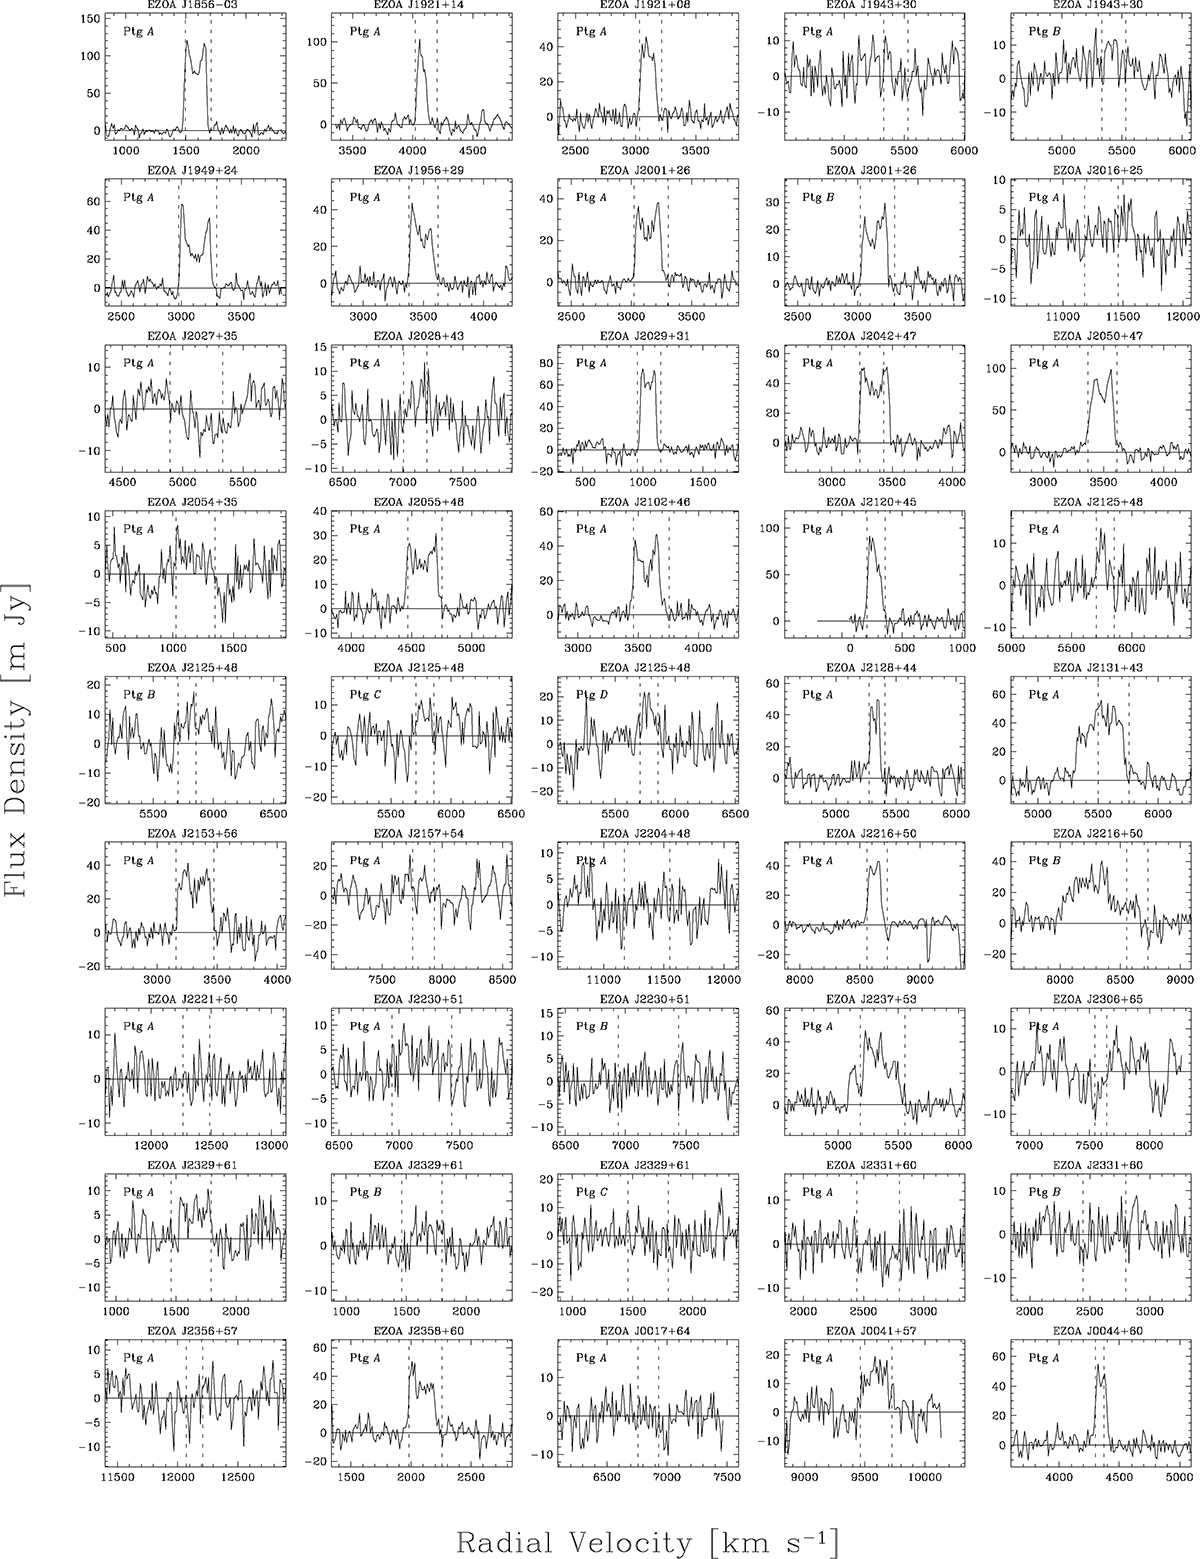
Fig. B.1.
Download original image
NRT 21cm H I line spectra of EZOA source observations. The velocity resolution is 10 km s−1. The pointing ID (see Table B.1) is indicated for each spectrum. To help the comparison with the EBHIS detections, the dashed vertical lines in each spectrum indicate the velocity range of the EBHIS detection, which was excluded in the EBHIS baseline fit.
Current usage metrics show cumulative count of Article Views (full-text article views including HTML views, PDF and ePub downloads, according to the available data) and Abstracts Views on Vision4Press platform.
Data correspond to usage on the plateform after 2015. The current usage metrics is available 48-96 hours after online publication and is updated daily on week days.
Initial download of the metrics may take a while.