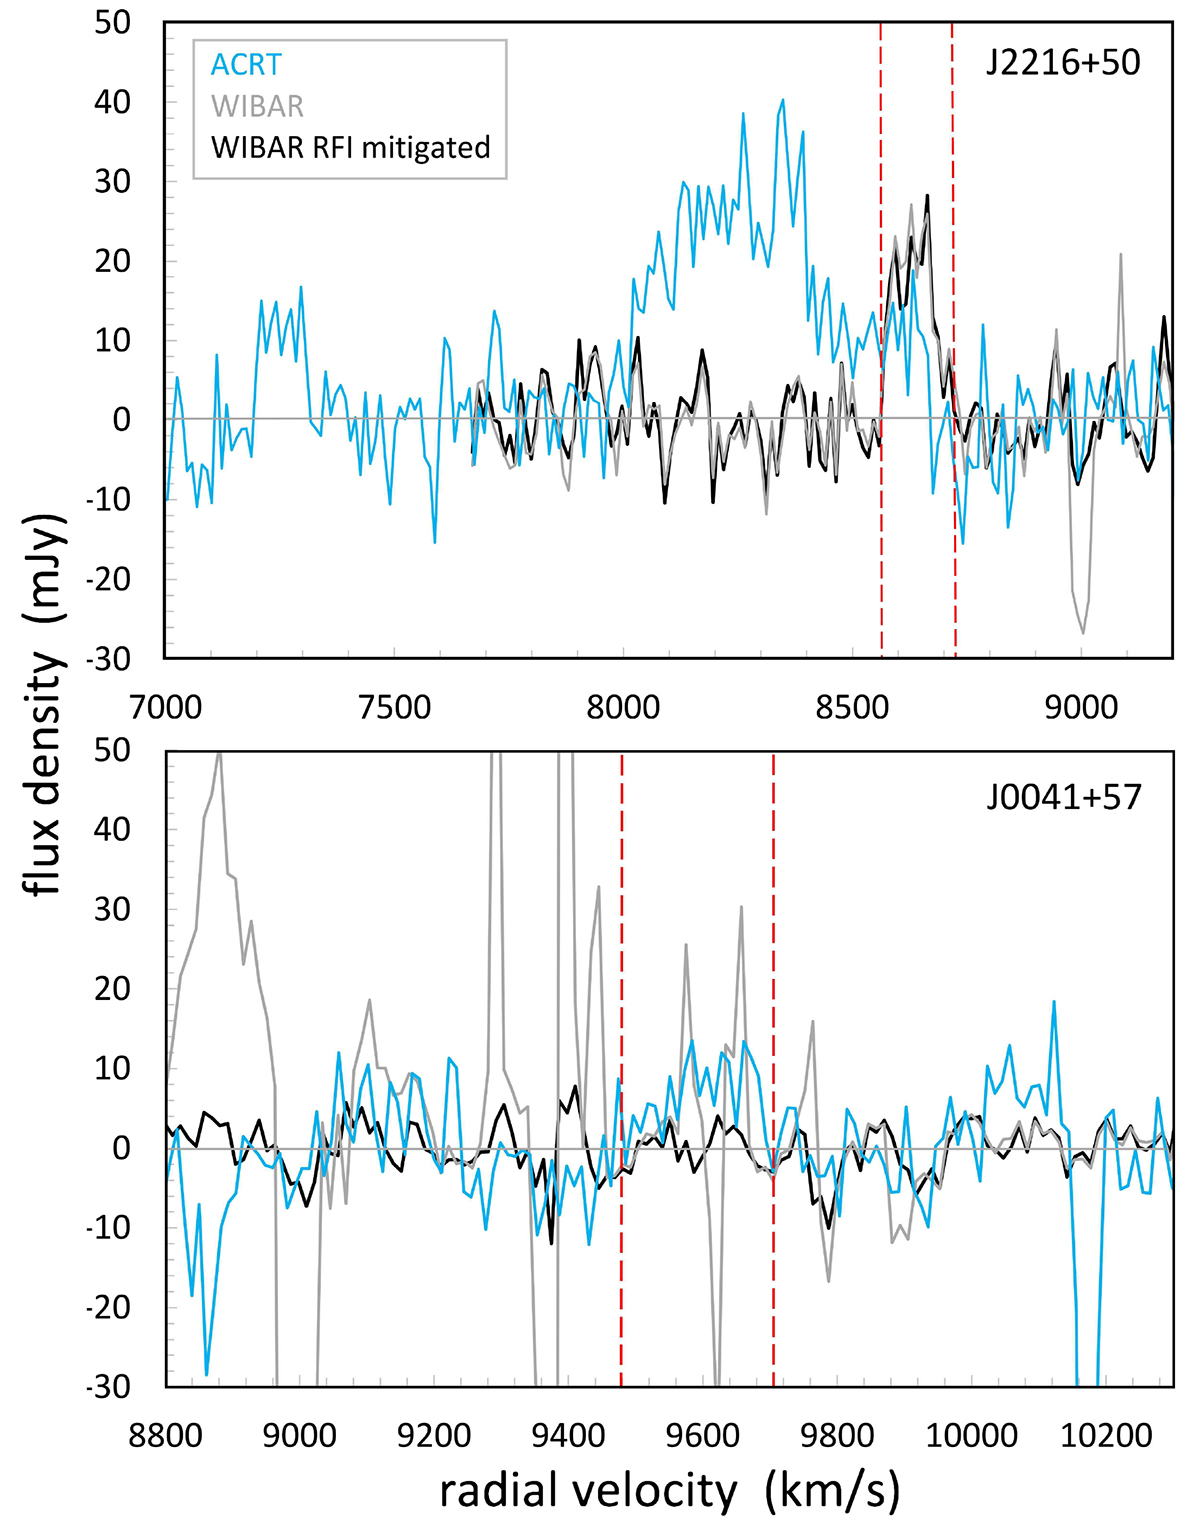
Fig. 3.
Download original image
Results of RFI mitigation test observations of two objects. Shown are standard Nançay ACRT auto-correlator H I line spectra (in blue) and spectra obtained with the WIBAR broadband receiver, both without RFI mitigation (in grey) and after RFI mitigation using the ROBEL software package (in black). Shown is flux density (in millijansky) as a function of heliocentric radial velocity in the optical framework, cz (in km s−1). The velocity resolution is 11.1 km s−1 for the WIBAR spectra, and 10.3 km s−1 for the standard ACRT spectra. The pairs of vertical dotted red lines indicate the profile widths of the EBHIS spectra.
Current usage metrics show cumulative count of Article Views (full-text article views including HTML views, PDF and ePub downloads, according to the available data) and Abstracts Views on Vision4Press platform.
Data correspond to usage on the plateform after 2015. The current usage metrics is available 48-96 hours after online publication and is updated daily on week days.
Initial download of the metrics may take a while.