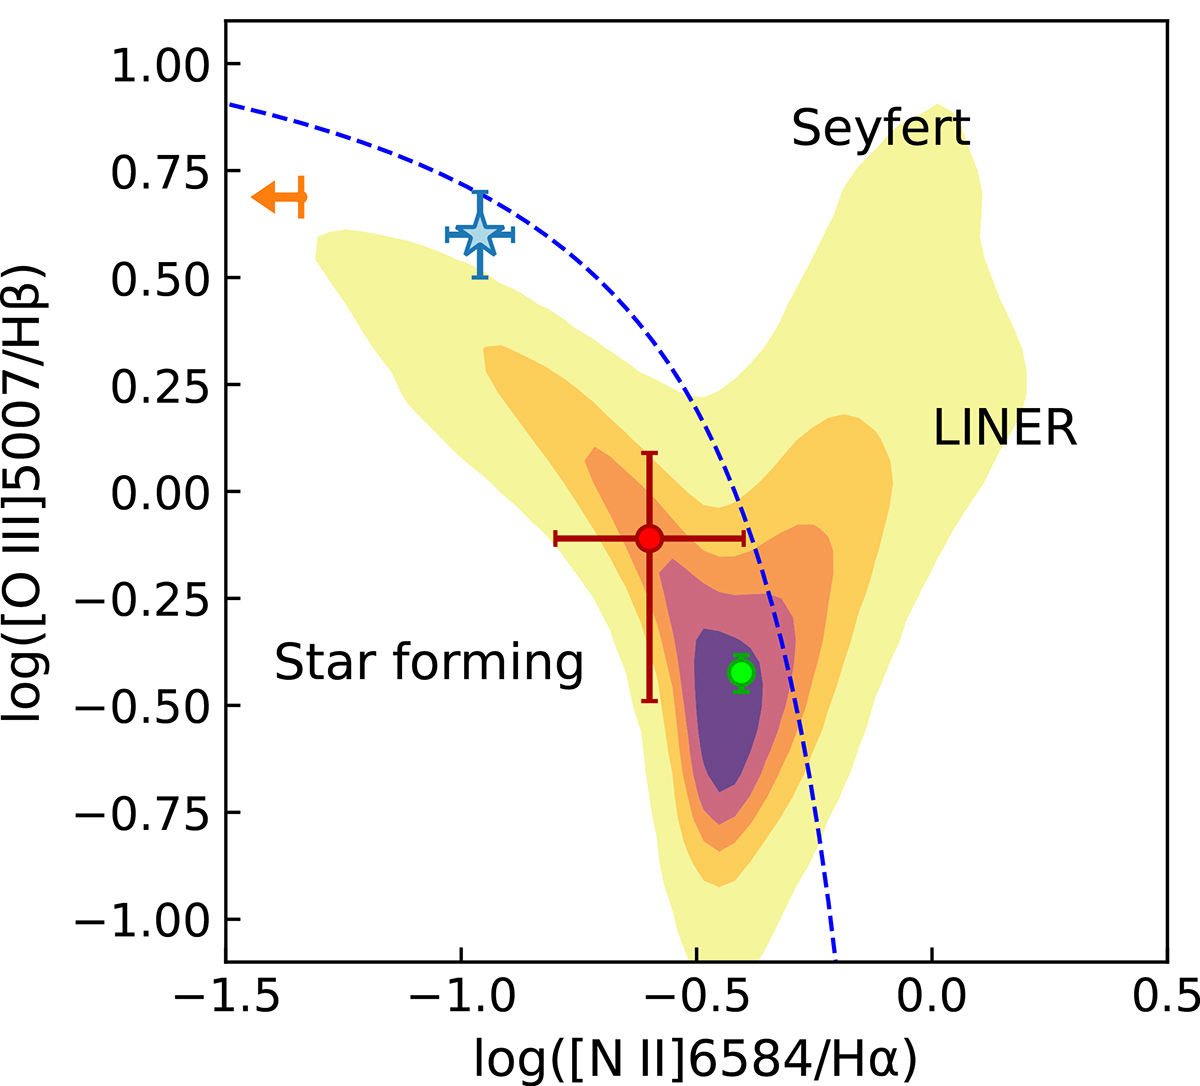
Fig. C.1.
Download original image
Baldwin-Phillips-Terlevich empirical optical emission-line diagnostic diagram using the optical line ratios [N II]/Hα and [O III]/Hβ. Shade areas represent the distribution of galaxies with both u′ and r′ meaningful Petrosian magnitudes in the SDSS catalogue. The dashed line, computed by Kauffmann et al. (2003), delimits the star-forming galaxies region. The FRB 20240114A host galaxy is marked by a filled star. The orange arrow marks the [N II]/Hα upper limit for the FRB 20121102A host (Tendulkar et al. 2021); FRB 20181030A (Bhardwaj et al. 2021) and FRB 20201124A (Bruni et al. 2024) hosts are marked in red and green, respectively.
Current usage metrics show cumulative count of Article Views (full-text article views including HTML views, PDF and ePub downloads, according to the available data) and Abstracts Views on Vision4Press platform.
Data correspond to usage on the plateform after 2015. The current usage metrics is available 48-96 hours after online publication and is updated daily on week days.
Initial download of the metrics may take a while.