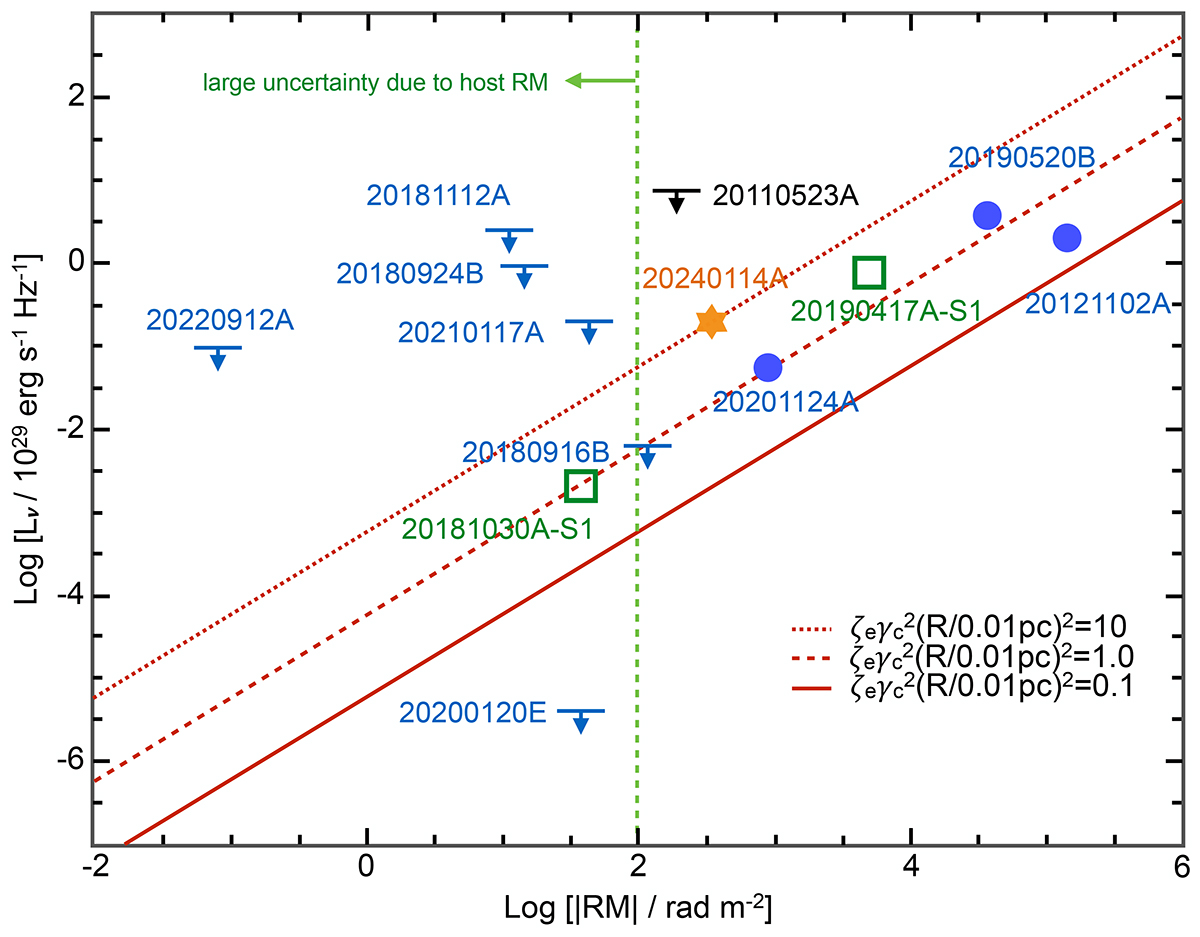
Fig. 3.
Download original image
Proposed relation between the PRS specific radio luminosity and the FRB RM adopting the general nebula model from Yang et al. (2020, 2022) The red dotted, dashed, and solid lines denote the predicted relations for ξeγc2(R/0.01 pc)2 = 10, 1.0, and 0.1, respectively. The blue circles denote the FRBs with measured persistent emission flux and RM (FRBs 20121102A, 20190520B, and 20201124A). The green squares denote the PRS candidates of 20181030A-S1 and 20190417A-S1 given by Ibik et al. (2024). The black upper limit indicates the non-localised FRB 20110523A with an upper limit of the persistent emission and a measured value of RM, which gives one of the most conservative constraints for non-localised sources in the literature. The blue upper limits correspond to the FRBs with precise (arcsecond) localisations. Owing to the large RM uncertainty of the host interstellar medium, the data of FRBs with |RM|≲100 rad m−2 (on the left side of the green dashed line) might substantially deviate from the predicted relation.
Current usage metrics show cumulative count of Article Views (full-text article views including HTML views, PDF and ePub downloads, according to the available data) and Abstracts Views on Vision4Press platform.
Data correspond to usage on the plateform after 2015. The current usage metrics is available 48-96 hours after online publication and is updated daily on week days.
Initial download of the metrics may take a while.