Fig. 1.
Download original image
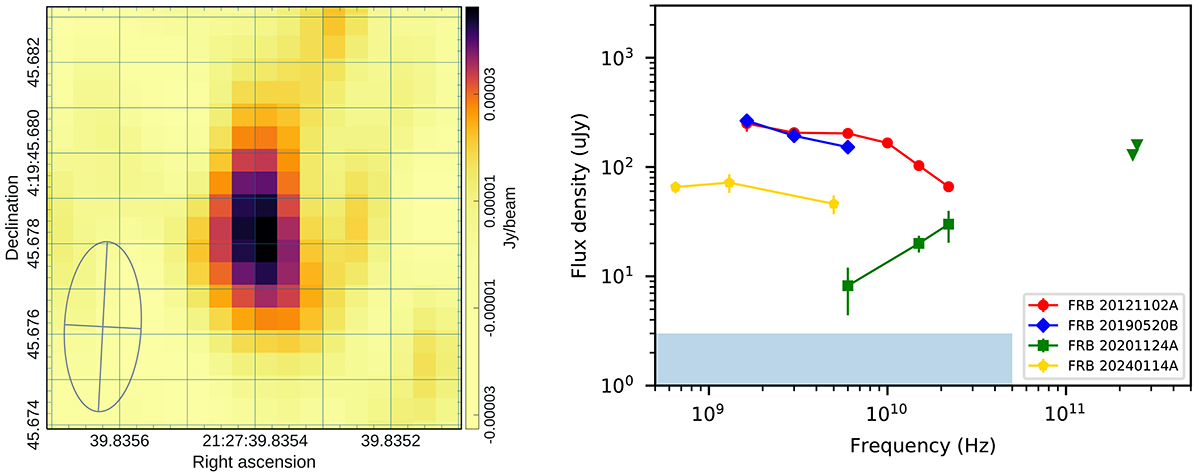
Left panel: Very Long Baseline Array image of the PRS at 5 GHz. The FWHM (3.7 × 1.7 mas) is shown in the lower-left corner. Right panel: Radio spectral shapes of the four PRSs discovered so far. This image was built with VLA data (except for our VLBA 5 GHz measurement). The blue shaded area represents the region below the 3-σ VLA sensitivity in the range 1–50 GHz.
Current usage metrics show cumulative count of Article Views (full-text article views including HTML views, PDF and ePub downloads, according to the available data) and Abstracts Views on Vision4Press platform.
Data correspond to usage on the plateform after 2015. The current usage metrics is available 48-96 hours after online publication and is updated daily on week days.
Initial download of the metrics may take a while.