| Issue |
A&A
Volume 695, March 2025
|
|
|---|---|---|
| Article Number | L15 | |
| Number of page(s) | 7 | |
| Section | Letters to the Editor | |
| DOI | https://doi.org/10.1051/0004-6361/202453214 | |
| Published online | 17 March 2025 | |
Letter to the Editor
Spatially resolved dust properties over 50 kpc in a hyperluminous galaxy merger at z = 4.6
1
Department of Physics, University of Crete, 70013 Heraklion, Greece
2
Institute of Astrophysics, Foundation for Research and Technology – Hellas (FORTH), 70013 Heraklion, Greece
3
School of Sciences, European University Cyprus, Diogenes street, Engomi, 1516 Nicosia, Cyprus
4
European Southern Observatory, Karl-Schwarzschild-Str. 2, 85748 Garching bei Müchen, Germany
5
Instituto de Astrofísica de Canarias, E-38205 La Laguna, Tenerife, Spain
6
Universidad de La Laguna, Dpto. Astrofísica, E-38206 La Laguna, Tenerife, Spain
7
Instituto de Estudios Astrofísicos, Facultad de Ingeniería y Ciencias, Universidad Diego Portales, Av. Ejército Libertador 441, Santiago, Chile
8
Jet Propulsion Laboratory, California Institute of Technology, 4800 Oak Grove Dr., Pasadena, CA 91109, USA
9
IPAC, California Institute of Technology, 1200 E. California Boulevard, Pasadena, 91125 CA, USA
10
School of Physics and Astronomy, University of Leicester, Leicester LE1 7RH, UK
11
INAF – Osservatorio di Astrofisica e Scienza dello Spazio di Bologna, Via Gobetti 93/3, I-40129 Bologna, Italy
12
Department of Physics, Winona State University, 175 West Mark Street, Winona, 55987 MN, United States
13
Instituto de Astrofísica, Facultad de Física, Pontificia Universidad Católica de Chile, Santiago 7820436, Chile
14
Las Campanas Observatory, Carnegie Institution of Washington, Raúl Bitrán 1200, La Serena, Chile
15
Department of Physics, Northwestern College, 101 7th St SW, Orange City, IA 51041, USA
16
National Astronomical Observatories, Chinese Academy of Sciences, Beijing 100101, China
17
University of Chinese Academy of Sciences, Beijing 100049, China
18
Chinese Academy of Sciences South America Center for Astronomy, National Astronomical Observatories, CAS, Beijing 100101, China
19
Institute for Frontiers in Astronomy and Astrophysics, Beijing Normal University, Beijing 102206, China
20
Centre for Space Research, North-West University, Potchefstroom 2520, South Africa
21
Department of Physics, College of Natural and Computational Science, Debre Berhan University, P.O. Box 445 Debre Berhan, Ethiopia
⋆ Corresponding author; This email address is being protected from spambots. You need JavaScript enabled to view it.
Received:
28
November
2024
Accepted:
13
February
2025
Abstract
We present spatially resolved dust-continuum ALMA observations from rest frame ∼60 to ∼600 μm (bands 3–10) of the hyperluminous hot dust-obscured galaxy (hot DOG) WISE J224607.6–052634.9 (W2246–0526), at redshift z = 4.6. W2246–0526 is interacting with at least three companion galaxies, forming a system connected by tidal streams. We model the multiwavelength ALMA observations of the dust continuum using a modified blackbody, from which we derive the dust properties (mass, emissivity index, area of the emitting region, and temperature) in the hot DOG and in resolved structures across a region of nearly ∼50 kpc. The peak temperature at the location of the hot DOG, ∼110 K, is likely the consequence of heating by the central quasar. The dust temperature drops to ∼40 K at a radius of ∼8 kpc, suggesting that heating by the quasar beyond that distance is non-dominant. The dust in the connecting streams between the host and companion galaxies is at temperatures between 30 and 40 K, typical of starburst galaxies, suggesting it is most likely heated by recent in situ star formation. This is the first time that dust properties have been spatially resolved over several tens of kiloparsec in a galaxy system beyond Cosmic Noon; this is more than six times the scales previously probed in galaxies at these redshifts.
Key words: galaxies: active / intergalactic medium / galaxies: ISM / galaxies: individual: WISE J2246-0526 / galaxies: nuclei / quasars: general
© The Authors 2025
 Open Access article, published by EDP Sciences, under the terms of the Creative Commons Attribution License (https://creativecommons.org/licenses/by/4.0), which permits unrestricted use, distribution, and reproduction in any medium, provided the original work is properly cited.
This article is published in open access under the Subscribe to Open model. This email address is being protected from spambots. You need JavaScript enabled to view it. to support open access publication.
1. Introduction
Supermassive black holes (SMBHs) and their host galaxies assembled most of their mass in the early Universe (z ∼ 1 − 6), making it a critical epoch for galaxy evolution. During these periods of intense accretion and growth, SMBHs are expected to be active and obscured by dust and gas (e.g., Hickox & Alexander 2018), with active galactic nuclei (AGN) feedback likely shaping the properties of their interstellar medium (ISM; e.g., Fiore et al. 2017; Lammers et al. 2023). Consequently, the study of obscured quasars at high redshift is critical for understanding the evolution of massive galaxies. Specifically, obtaining spatially resolved observations is key to revealing the effect of AGN on their hosts.
Spatially resolved studies of dust properties in nearby galaxies are relatively common (e.g., Mentuch Cooper et al. 2012; Galametz et al. 2012; Zhou et al. 2016; Utomo et al. 2019). At high redshift, however, the need for high resolution and sensitivity makes them very challenging. The Atacama Large Millimeter/submillimeter Array (ALMA) is one of the few facilities capable of reaching the necessary sensitivity to detect the lowest surface brightness emission of the coldest dust component in the far-infrared (FIR). However, mapping large areas and covering wide dynamic ranges at different frequencies remains very time consuming, even for bright objects. Only a few studies using ALMA have reported spatially resolved dust temperature measurements in high-redshift galaxies. Litke et al. (2022) studied a tightly resolved starburst galaxy at z = 5.7, finding a global temperature of 48.3 K over ∼4 kpc. Akins et al. (2022) presented a ∼7 kpc resolved temperature map for a star-forming galaxy at z = 7.13, with a global temperature of  K. In the literature we identify only three other studies targeting quasar host galaxies with ALMA. Shao et al. (2022) observed a FIR luminous quasar at z = 6.0 and found a clear temperature gradient over ∼3 kpc radius toward the center, associated with the AGN. The dust temperature peaks at ∼70 K, and the global temperature is Td = 53 ± 4 K. Tsukui et al. (2023) reported a resolved dust temperature map for a quasar host galaxy at z = 4.4, with a gradient peaking at 57.1 ± 0.3 K and outer temperatures of ∼38 K up to ∼4 kpc from the center. They associate the peak and gradient with warm dust heated by an AGN. Finally, Walter et al. (2022) targeted a quasar at z = 6.9 and also found a temperature gradient ranging from over 130 K in the central resolution element (200 pc) to 30 K at 500 pc. These studies show how multiband resolved ALMA observations can probe quasar-heated dust in galaxies at high redshift.
In particular, hot dust-obscured galaxies (hot DOGs; Eisenhardt et al. 2012; Wu et al. 2012), among all obscured quasar populations, are unique sources that can be used to study the interplay between AGN and dust. Given their extreme luminosities (Lbol > 1013 L⊙, Tsai et al. 2015), strong SMBH accretion (Wu et al. 2018; Li et al. 2024), and high ISM turbulence (Díaz-Santos et al. 2021), the ISM of hot DOGs likely experiences strong heating and feedback from the central quasar. In particular, WISE J224607.6–052634.9 (W2246–0526) is the most distant known hot DOG, at z = 4.6, only 1.3 Gyr after the Big Bang. Its extreme luminosity (Lbol = 3.6 × 10¹⁴ L⊙, Tsai et al. 2018) is mainly driven by its central quasar, which is likely undergoing super-Eddington accretion (λEdd = 3.6, Tsai et al. 2018) and most probably irradiating its surrounding ISM with intense X-ray emission (Fernández Aranda et al. 2024). W2246–0526 is also undergoing a multiple merger, with dust tidal streams connecting the hot DOG with at least three minor galaxy companions, as shown by Díaz-Santos et al. (2018) using ALMA Band 6 dust-continuum observations. The gas kinematics of W2246–0526 strongly suggests the presence of a large-scale turbulent outflow (Díaz-Santos et al. 2016), as well as several powerful and asymmetric nuclear outflows concentrated within the central 0.22″ (∼1.5 kpc; Liao et al., in prep.).
In this Letter we present spatially resolved dust observations and properties for the entire W2246–0526 merging system over ∼7.7″ (∼50 kpc). Throughout the paper we assume a flat ΛCDM cosmology with H0 = 70 km s−1 Mpc−1 and ΩM = 0.3.
2. Observations and analysis
The W2246–0526 merger system was observed with the ALMA 12 m array during multiple cycles. The observations we compile in this Letter are detailed in Table 1. We reduced and calibrated the data using the Common Astronomy Software Applications (CASA; McMullin et al. 2007) with the standard data reduction procedures. To image the continuum using the tclean task of CASA v6.5, we ran the Hogbom cleaning algorithm (Högbom 1974) to a flux density threshold of two times the root mean square (rms) of each cube, with the Briggs weighting mode set to robustness = 2.0 (close to natural weighting), and with a uv-taper imaging weight equal to 0.8″ to enhance any extended emission. We further chose to homogenize all the datasets to the same resolution, matching the largest beam after the uv-tapering, by setting the restoring beam in tclean to a common circular beam of full width at half maximum (FWHM) = 1.0″. The cleaning was done using a circular mask with a radius of 7″, enough to cover the entire merging system. In each dataset, all emission line-free channels were combined to create the continuum intensity maps, which are shown in Fig. C.1. The entire resolved dust structures of the merger presented by Díaz-Santos et al. (2018) are detected in four of the eight datasets used in this work, and are shown with the overlapped 2.5σ contours in Fig. 1. The non-detection of the extended structures in the other four datasets may be due to smaller maximum recoverable scales in those observations, as shown in Table 1.
Continuum ALMA observations.
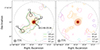 |
Fig. 1. W2246–0526 continuum emission at various FIR wavelengths used in this study. Shown are the 2.5σ contours for the four spatially resolved datasets (left), along with the three companions detected and labeled in Díaz-Santos et al. (2018), and for the four datasets that do not show the entire resolved dust structures (right). The legends indicate their central rest-frame wavelength. The orange background color map corresponds to the overlapping of the four resolved datasets. The dot-dashed gray circle shows the 7″ radius mask used to clean the datasets. The beam and physical scale are shown in the lower left corner. There is emission from all eight datasets only at the hot DOG position, in the central beam. We note the ∼35 kpc dusty stream between W2246–0526 and the companion C2. |
To characterize the FIR continuum emission in the system, we used a modified blackbody. Starting with the full radiative transfer equation, the flux density observed at frequency νobs is
![Mathematical equation: $$ \begin{aligned} S_{\nu _{\mathrm{obs} }} = \frac{A}{D_L^2}[B_{\nu _{\mathrm{rest} }}(T_d)-B_{\nu _{\mathrm{rest} }}(T_{\mathrm{CMB} })][1-\exp (-\tau _{\nu _{\mathrm{rest} }})](1+z), \end{aligned} $$](/articles/aa/full_html/2025/03/aa53214-24/aa53214-24-eq2.gif) (1)
(1)
where A is the physical area of emission, DL the luminosity distance, Td the temperature of the dust, TCMB the cosmic microwave background (CMB) temperature at the redshift of the source. Here the blackbody emission is
 (2)
(2)
and the optical depth of the dust
 (3)
(3)
where β is the dust emissivity index, Md is the dust mass, and κ0 is the dust opacity at the reference frequency ν0. Following Scoville et al. (2014) and assuming a gas-to-dust ratio of δGDR = 200, given that the metallicity in the hot DOG is ∼0.5 Z⊙ (Fernández Aranda et al. 2024), we adopt κ0 = κ850 μm = 0.0968 kg−1 m2 and ν0 = 352.7 GHz (850 μm). We note that Td is the dust temperature including the CMB heating, which at our redshift and for temperatures above 30 K (see Sect. 3) is negligible (less than 1%; da Cunha et al. 2013).
We fit the modified blackbody of Eq. (1) to every pixel with emission from the four spatially resolved datasets to derive the properties of the dust in the resolved structures. We used a Markov chain Monte Carlo approach using the emcee (Foreman-Mackey et al. 2013) Python package, allowing A, Td, Md, and β to vary freely using flat priors of 10−2 < A < 33 kpc2, 12.6 < Td < 300 K, 106 < Md < 1010 M⊙, and 1 < β < 3. The beam area limits the physical area of emission A, and the lower temperature limit corresponds to TCMB at z = 4.601. We also fit Eq. (1) for the integrated central beam, corresponding to the hot DOG, for which we have emission from all eight datasets.
3. Results
In Fig. 2 we show the spectral energy distribution (SED) fit and the marginalized posterior distributions (PDFs) of the parameters for the integrated central beam, which contains the hot DOG, using all eight datasets. The corresponding fluxes are presented in Table A.1 and the best-fit dust parameters in Table 2. The model parameters for the central beam are well constrained for a single modified blackbody, with β = 1.74 ± 0.08,  ,
,  K, and
  kpc2. The best-fit physical area of emission, A, is equivalent to that of a circle of diameter ∼1 kpc, or 0.15″, much smaller than the resolution of our observations (typically 0.4″; see Table 1) and consistent with a compact heating source. The area obtained from the fit is also consistent with the size of the region where the brightest fine-structure FIR emission lines are produced, with an upper limit on the radius of 800 pc from the central quasar (Fernández Aranda et al. 2024). In addition, our result for the temperature of the hot DOG is close to that obtained from the W2246–0526 SED fit using UV to submillimeter maps performed by Sun et al. (2024), which found Td ∼ 92 K, and higher than the estimates for the coldest dust component from Díaz-Santos et al. (2018) and Tsai et al. (in prep.) of ∼70 K, which assume optically thin dust.
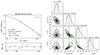 |
Fig. 2. Dust SED modeling for the central beam (the hot DOG). Left: Observed continua flux (purple points) as a function of rest-frame wavelength, and fitted modified blackbody (green line). The best-fit parameters and reduced χ2 of the fit are indicated in the plot, and the residuals of the fit are shown in the bottom panel. Right: Corner plot showing the marginalized 1D and 2D posterior probability distributions for the parameters used to fit the modified blackbody. The green solid lines show the position of the best-fit values, and the dashed lines indicate the 68% confidence interval. The high dust temperature suggests that the quasar is likely the primary source of heating. |
Dust parameters for the hot DOG.
In Fig. 3 we present the spatially resolved maps of the best-fit parameters using the four datasets where extended emission is detected, from rest frame 149 to 357 μm. The temperature peaks at more than 100 K at the location of the quasar, and gradually descends to ∼40 K over a scale of ∼8 kpc, suggesting the quasar is heating the surrounding dust out to this distance. The dust temperature measured in the extended structures surrounding the hot DOG is relatively low, ∼30–40 K, and typical of star-forming galaxies at similar redshifts (e.g., Béthermin et al. 2020; Cortzen et al. 2020; Faisst et al. 2020). The dust mass distribution also peaks in the central region, and the combined dust mass of the whole system is 5.1 × 10⁸ M⊙. The dust emissivity index β takes values in the range ∼1.4–2.0. The values for Md and β are consistent with those from recent studies of various galaxy populations such as quasars, and star-forming and submillimeter galaxies at 1 < z < 8 (e.g., da Cunha et al. 2021; Kaasinen et al. 2024). The physical areas of emission vary between ∼500 pc2 and ∼1 kpc2, much smaller than the ∼30 kpc2 beam, implying areal filling factors of dust of 3% or smaller.
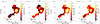 |
Fig. 3. Resolved maps of the four fitted dust parameters (temperature, mass, emissivity index, and area of the emitting region). All units are per beam. A black cross marks the peak of continuum emission, i.e., the position of the quasar. The beam and physical scale are shown at the bottom left of each map. The dust properties are derived in the entire merger system, over ∼50 kpc. |
Figure B.1 shows other derived dust properties. The optical thickness τν using Eq. (3) is shown at rest frame 158 μm, and indicates that even at these wavelengths there are some areas in the system that display significant absorption. We also present the total IR luminosity (3 − 1100 μm) map derived by integrating the fitted modified blackbody of each pixel. L3 − 1100 μm peaks at ∼6 × 10¹³ L⊙ beam−1 in the central region, and gradually descends to ∼1011 − 1012 L⊙. Additionally, we estimate the star formation rate (SFR) surface density (ΣSFR) as ΣSFR = SFR/A. The SFR is estimated from LIR as in Kennicutt & Evans (2012), and A is the intrinsic area derived from the modified blackbody fitting. Finally, we show the star formation efficiency (SFE), calculated as SFE = SFR/Mgas, with Mgas = Md × δGDR. The SFE is enhanced in the north and the southeast of the system, reaching values as high as 10−7.25 yr−1.
4. Discussion
The temperature peak of ∼110 K measured in W2246–0526 is among the highest measured to date in galaxies at high redshift, and is consistent with quasar heating. Integrating the modified blackbody fitted to the central beam results in a L3 − 1100 μm = 6.4 × 10¹³ L⊙; this does not include emission from hotter dust, which dominates the mid- and near-IR. To reproduce this luminosity we would require a ΣSFR ∼ 104 M⊙ yr−1 kpc−2. This is well above the characteristic Eddington limit set by radiation pressure on dust grains in optically thick disks of ΣSFR ∼ 103 M⊙ yr−1 kpc−2 (Thompson et al. 2005), suggesting that an obscured AGN is a more likely source of heating than an obscured, compact, extreme starburst. This agrees with other studies stating that a starburst is unlikely to be the dominant source of energy in extremely luminous hot DOGs (Eisenhardt et al. 2012; Tsai et al. 2015).
Figure 1 shows that we resolve the dust emission over scales of 50 kpc. Theoretical models predict that sources with Lbol > 1014 L⊙ can heat dust to temperatures of 30–40 K at distances of tens of kiloparsec if there are optically thin lines of sight (Scoville 2013). In such cases, a temperature gradient would be expected, with dust being colder farther from the central quasar. However, our results show a fairly constant dust temperature across the tidal streams and companion galaxies. While we cannot entirely rule out quasar heating, especially if optical depth variations are present along the quasar’s line of sight, the uniformity of the temperatures suggests that the dust in these extended structures is predominantly heated by in situ star formation. This indicates that stars are likely being formed within the dusty streams as they fly by or are accreted onto the central quasar and its host galaxy. We also estimated the SFR in the extended component to be ∼ 800 M⊙ yr−1 by integrating the luminosity of the system outside the central 2″ region displaying higher dust temperature. This is consistent with previous SFR estimations for W2246–0526 from total source integrated values (Sun et al. 2024), and lower and upper limits for the companions (Díaz-Santos et al. 2018). We speculate that the stellar mass being accreted into the central host during the merger process may include a contribution from star formation occurring in infalling non-self-gravitating structures. In addition, a fraction of the stars formed in the dusty streams in the W2246–0526 system may end up as part of a future stellar halo.
Figures 3 and B.1 show central anisotropies in A, β, and τν. The area parameter has significant uncertainties (i.e.,  kpc2 for the central beam), which makes the observed asymmetry in A tentative. The fit to the β parameter is much more robust, however, and we also observe an anisotropy, with higher β values toward the southwest. The optical depth map shows the same anisotropy, but it virtually disappears if we fix β in the fit. Therefore, greater optical depths are mainly driven by higher values of β.
Finally, the high SFE regions coincide with the position of two companion galaxies detected in Díaz-Santos et al. (2018), to the north and the southeast of the hot DOG (C2 and C3 in Fig. 1). Their ΣSFR ∼ 102 M⊙ yr−1 kpc−2 is consistent with star formation, while their SFE correspond to molecular gas depletion times of less than 100 Myr, a relatively low value compared with starburst galaxies at low and high redshifts (e.g., Huang & Kauffmann 2014; Elbaz et al. 2018; Tacconi et al. 2018). Previous studies have suggested the SFE can be enhanced by ongoing mergers (e.g., Genzel et al. 2010; Díaz-García & Knapen 2020; Sargent et al. 2024). Our result agrees with this interpretation, since W2246–0526 is experiencing multiple mergers. Although we cannot rule out the presence of additional obscured AGN in these companions, their contribution to the dust heating is likely minor, as suggested by their uniform temperature compared to the streams.
5. Summary
We present spatially resolved ALMA multiband continuum observations of the W2246–0526 hot DOG merging system, at z = 4.6. Fitting a modified blackbody to the data pixel-by-pixel, we derived for the first time the spatially resolved dust properties over a scale of ∼50 kpc in a system only 1.3 Gyr after the Big Bang. The system contains an estimated total mass of dust of 5.1 × 10⁸ M⊙. The dust temperature peaks at the position of the hot DOG at ∼110 K and decreases radially, suggesting that dust is being heated by the central quasar up to a distance of ∼8 kpc. The dust in the tidal streams around the hot DOG and within the companion galaxies is at a relatively uniform temperature of 30–40 K with no evident gradients, suggesting that the streams and companions are heated by obscured, recent star formation. These newly formed stars could contribute to the mass growth of the central galaxy and SMBH in W2246–0526 or eventually become part of a stellar halo, highlighting the potential role of extended structures in the mass assembly of high-redshift galaxies.
Acknowledgments
This work is supported by the European Research Council under grant agreement No. 771282. MA acknowledges support from the ANID Basal Project FB210003 and ANID MILENIO NCN2024_112. RJA was supported by FONDECYT grant number 1231718 and by the ANID BASAL project FB210003. C.-W. T. is Supported by NSFC No. 11988101 and the International Partnership Program of the Chinese Academy of Sciences, Program No. 114A11KYSB20210010. RD acknowledges support from the INAF GO 2022 grant “The birth of the giants: JWST sheds light on the build-up of quasars at cosmic dawn” and from PRIN MUR “2022935STW” RFF M4.C2.1.1, CUP J53D23001570006 and C53D23000950006. Portions of this research were carried out at the Jet Propulsion Laboratory, California Institute of Technology, under a contract with NASA. TDS acknowledges the research project was supported by the Hellenic Foundation for Research and Innovation (HFRI) under the “2nd Call for HFRI Research Projects to support Faculty Members & Researchers” (Project Number: 03382). This paper makes use of the following ALMA data: ADS/JAO.ALMA#2013.1.00576.S, ADS/JAO.ALMA#2015.1.00883.S, ADS/JAO.ALMA#2016.1.00668.S, ADS/JAO.ALMA#2017.1.00899.S, ADS/JAO.ALMA#2018.1.00119.S, ADS/JAO.ALMA#2018.1.00333.S, ADS/JAO.ALMA#2021.1.00726.S. ALMA is a partnership of ESO (representing its member states), NSF (USA) and NINS (Japan), together with NRC (Canada), NSTC and ASIAA (Taiwan), and KASI (Republic of Korea), in cooperation with the Republic of Chile. The Joint ALMA Observatory is operated by ESO, AUI/NRAO and NAOJ.
References
- Akins, H. B., Fujimoto, S., Finlator, K., et al. 2022, ApJ, 934, 64 [NASA ADS] [CrossRef] [Google Scholar]
- Béthermin, M., Fudamoto, Y., Ginolfi, M., et al. 2020, A&A, 643, A2 [Google Scholar]
- Cortzen, I., Magdis, G. E., Valentino, F., et al. 2020, A&A, 634, L14 [EDP Sciences] [Google Scholar]
- da Cunha, E., Groves, B., Walter, F., et al. 2013, ApJ, 766, 13 [Google Scholar]
- da Cunha, E., Hodge, J. A., Casey, C. M., et al. 2021, ApJ, 919, 30 [NASA ADS] [CrossRef] [Google Scholar]
- Díaz-García, S., & Knapen, J. H. 2020, A&A, 635, A197 [NASA ADS] [CrossRef] [EDP Sciences] [Google Scholar]
- Díaz-Santos, T., Assef, R. J., Blain, A. W., et al. 2016, ApJ, 816, L6 [Google Scholar]
- Díaz-Santos, T., Assef, R. J., Blain, A. W., et al. 2018, Science, 362, 1034 [Google Scholar]
- Díaz-Santos, T., Assef, R. J., Eisenhardt, P. R. M., et al. 2021, A&A, 654, A37 [NASA ADS] [CrossRef] [EDP Sciences] [Google Scholar]
- Eisenhardt, P. R. M., Wu, J., Tsai, C.-W., et al. 2012, ApJ, 755, 173 [Google Scholar]
- Elbaz, D., Leiton, R., Nagar, N., et al. 2018, A&A, 616, A110 [NASA ADS] [CrossRef] [EDP Sciences] [Google Scholar]
- Faisst, A. L., Fudamoto, Y., Oesch, P. A., et al. 2020, MNRAS, 498, 4192 [NASA ADS] [CrossRef] [Google Scholar]
- Fernández Aranda, R., Díaz Santos, T., Hatziminaoglou, E., et al. 2024, A&A, 682, A166 [NASA ADS] [CrossRef] [EDP Sciences] [Google Scholar]
- Fiore, F., Feruglio, C., Shankar, F., et al. 2017, A&A, 601, A143 [NASA ADS] [CrossRef] [EDP Sciences] [Google Scholar]
- Foreman-Mackey, D., Hogg, D. W., Lang, D., & Goodman, J. 2013, PASP, 125, 306 [Google Scholar]
- Galametz, M., Kennicutt, R. C., Albrecht, M., et al. 2012, MNRAS, 425, 763 [NASA ADS] [CrossRef] [Google Scholar]
- Genzel, R., Tacconi, L. J., Gracia-Carpio, J., et al. 2010, MNRAS, 407, 2091 [NASA ADS] [CrossRef] [Google Scholar]
- Hickox, R. C., & Alexander, D. M. 2018, ARA&A, 56, 625 [Google Scholar]
- Högbom, J. A. 1974, A&AS, 15, 417 [Google Scholar]
- Huang, M.-L., & Kauffmann, G. 2014, MNRAS, 443, 1329 [NASA ADS] [CrossRef] [Google Scholar]
- Kaasinen, M., Venemans, B., Harrington, K. C., et al. 2024, A&A, 684, A33 [NASA ADS] [CrossRef] [EDP Sciences] [Google Scholar]
- Kennicutt, R. C., & Evans, N. J. 2012, ARA&A, 50, 531 [NASA ADS] [CrossRef] [Google Scholar]
- Lammers, C., Iyer, K. G., Ibarra-Medel, H., et al. 2023, ApJ, 953, 26 [NASA ADS] [CrossRef] [Google Scholar]
- Li, G., Assef, R. J., Tsai, C.-W., et al. 2024, ApJ, 971, 40 [NASA ADS] [CrossRef] [Google Scholar]
- Litke, K. C., Marrone, D. P., Aravena, M., et al. 2022, ApJ, 928, 179 [NASA ADS] [CrossRef] [Google Scholar]
- McMullin, J. P., Waters, B., Schiebel, D., Young, W., & Golap, K. 2007, ASP Conf. Ser., 376, 127 [Google Scholar]
- Mentuch Cooper, E., Wilson, C. D., Foyle, K., et al. 2012, ApJ, 755, 165 [NASA ADS] [CrossRef] [Google Scholar]
- Sargent, M. T., Ellison, S. L., Mendel, J. T., et al. 2024, ApJ, submitted [arXiv:2409.06572] [Google Scholar]
- Scoville, N. Z. 2013, in Secular Evolution of Galaxies, eds. J. Falcón-Barroso, & J. H. Knapen, 491 [CrossRef] [Google Scholar]
- Scoville, N., Aussel, H., Sheth, K., et al. 2014, ApJ, 783, 84 [CrossRef] [Google Scholar]
- Shao, Y., Wang, R., Weiss, A., et al. 2022, A&A, 668, A121 [NASA ADS] [CrossRef] [EDP Sciences] [Google Scholar]
- Sun, W., Fan, L., Han, Y., et al. 2024, ApJ, 964, 95 [NASA ADS] [CrossRef] [Google Scholar]
- Tacconi, L. J., Genzel, R., Saintonge, A., et al. 2018, ApJ, 853, 179 [Google Scholar]
- Thompson, T. A., Quataert, E., & Murray, N. 2005, ApJ, 630, 167 [Google Scholar]
- Tsai, C.-W., Eisenhardt, P. R. M., Wu, J., et al. 2015, ApJ, 805, 90 [Google Scholar]
- Tsai, C.-W., Eisenhardt, P. R. M., Jun, H. D., et al. 2018, ApJ, 868, 15 [NASA ADS] [CrossRef] [Google Scholar]
- Tsukui, T., Wisnioski, E., Krumholz, M. R., & Battisti, A. 2023, MNRAS, 523, 4654 [NASA ADS] [CrossRef] [Google Scholar]
- Utomo, D., Chiang, I.-D., Leroy, A. K., Sandstrom, K. M., & Chastenet, J. 2019, ApJ, 874, 141 [NASA ADS] [CrossRef] [Google Scholar]
- Walter, F., Neeleman, M., Decarli, R., et al. 2022, ApJ, 927, 21 [NASA ADS] [CrossRef] [Google Scholar]
- Wu, J., Tsai, C.-W., Sayers, J., et al. 2012, ApJ, 756, 96 [Google Scholar]
- Wu, J., Jun, H. D., Assef, R. J., et al. 2018, ApJ, 852, 96 [NASA ADS] [CrossRef] [Google Scholar]
- Zhou, L., Shi, Y., Diaz-Santos, T., et al. 2016, MNRAS, 458, 772 [NASA ADS] [CrossRef] [Google Scholar]
Appendix A: Central beam fluxes
Central beam fluxes.
Appendix B: Additional derived dust properties
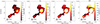 |
Fig. B.1. Same as Fig. 3, but for the derived dust properties (optical depth, infrared luminosity, ΣSFR, and SFE). The central ∼ 8 kpc radius is marked in the ΣSFR map and masked in the SFE map, as it is likely affected mainly by quasar heating. Some areas in the system seem to have very high SFE, with corresponding depletion times of only a few tens of Myr. |
Appendix C: Intensity maps
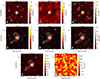 |
Fig. C.1. Intensity maps for the datasets of the W2246–0526 merging system. The central rest-frame wavelength of each continuum dataset is shown at the top of each panel, and the cyan circle in the bottom left of each panel represents the size of the ALMA beam (1″). The white solid contours indicate [3, 2n/2]×σ levels, with σ being the rms of the map, and n=[4,5,6,...]. The dashed contours show negative flux at the same absolute levels. |
All Tables
All Figures
|
Fig. 1. W2246–0526 continuum emission at various FIR wavelengths used in this study. Shown are the 2.5σ contours for the four spatially resolved datasets (left), along with the three companions detected and labeled in Díaz-Santos et al. (2018), and for the four datasets that do not show the entire resolved dust structures (right). The legends indicate their central rest-frame wavelength. The orange background color map corresponds to the overlapping of the four resolved datasets. The dot-dashed gray circle shows the 7″ radius mask used to clean the datasets. The beam and physical scale are shown in the lower left corner. There is emission from all eight datasets only at the hot DOG position, in the central beam. We note the ∼35 kpc dusty stream between W2246–0526 and the companion C2. |
| In the text | |
|
Fig. 2. Dust SED modeling for the central beam (the hot DOG). Left: Observed continua flux (purple points) as a function of rest-frame wavelength, and fitted modified blackbody (green line). The best-fit parameters and reduced χ2 of the fit are indicated in the plot, and the residuals of the fit are shown in the bottom panel. Right: Corner plot showing the marginalized 1D and 2D posterior probability distributions for the parameters used to fit the modified blackbody. The green solid lines show the position of the best-fit values, and the dashed lines indicate the 68% confidence interval. The high dust temperature suggests that the quasar is likely the primary source of heating. |
| In the text | |
|
Fig. 3. Resolved maps of the four fitted dust parameters (temperature, mass, emissivity index, and area of the emitting region). All units are per beam. A black cross marks the peak of continuum emission, i.e., the position of the quasar. The beam and physical scale are shown at the bottom left of each map. The dust properties are derived in the entire merger system, over ∼50 kpc. |
| In the text | |
|
Fig. B.1. Same as Fig. 3, but for the derived dust properties (optical depth, infrared luminosity, ΣSFR, and SFE). The central ∼ 8 kpc radius is marked in the ΣSFR map and masked in the SFE map, as it is likely affected mainly by quasar heating. Some areas in the system seem to have very high SFE, with corresponding depletion times of only a few tens of Myr. |
| In the text | |
|
Fig. C.1. Intensity maps for the datasets of the W2246–0526 merging system. The central rest-frame wavelength of each continuum dataset is shown at the top of each panel, and the cyan circle in the bottom left of each panel represents the size of the ALMA beam (1″). The white solid contours indicate [3, 2n/2]×σ levels, with σ being the rms of the map, and n=[4,5,6,...]. The dashed contours show negative flux at the same absolute levels. |
| In the text | |
Current usage metrics show cumulative count of Article Views (full-text article views including HTML views, PDF and ePub downloads, according to the available data) and Abstracts Views on Vision4Press platform.
Data correspond to usage on the plateform after 2015. The current usage metrics is available 48-96 hours after online publication and is updated daily on week days.
Initial download of the metrics may take a while.