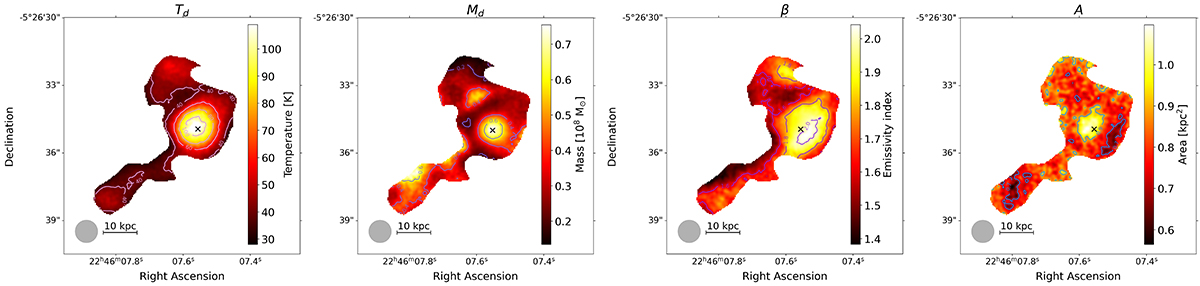
Fig. 3.
Download original image
Resolved maps of the four fitted dust parameters (temperature, mass, emissivity index, and area of the emitting region). All units are per beam. A black cross marks the peak of continuum emission, i.e., the position of the quasar. The beam and physical scale are shown at the bottom left of each map. The dust properties are derived in the entire merger system, over ∼50 kpc.
Current usage metrics show cumulative count of Article Views (full-text article views including HTML views, PDF and ePub downloads, according to the available data) and Abstracts Views on Vision4Press platform.
Data correspond to usage on the plateform after 2015. The current usage metrics is available 48-96 hours after online publication and is updated daily on week days.
Initial download of the metrics may take a while.