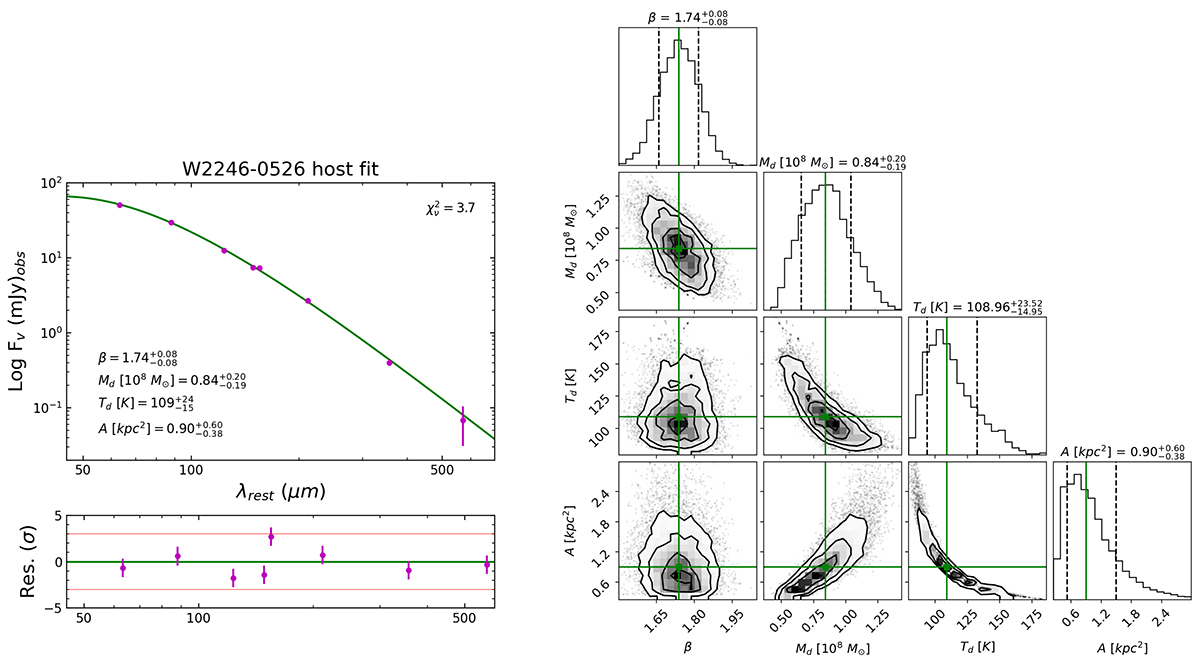
Fig. 2.

Download original image
Dust SED modeling for the central beam (the hot DOG). Left: Observed continua flux (purple points) as a function of rest-frame wavelength, and fitted modified blackbody (green line). The best-fit parameters and reduced χ2 of the fit are indicated in the plot, and the residuals of the fit are shown in the bottom panel. Right: Corner plot showing the marginalized 1D and 2D posterior probability distributions for the parameters used to fit the modified blackbody. The green solid lines show the position of the best-fit values, and the dashed lines indicate the 68% confidence interval. The high dust temperature suggests that the quasar is likely the primary source of heating.
Current usage metrics show cumulative count of Article Views (full-text article views including HTML views, PDF and ePub downloads, according to the available data) and Abstracts Views on Vision4Press platform.
Data correspond to usage on the plateform after 2015. The current usage metrics is available 48-96 hours after online publication and is updated daily on week days.
Initial download of the metrics may take a while.


