Fig. C.1.
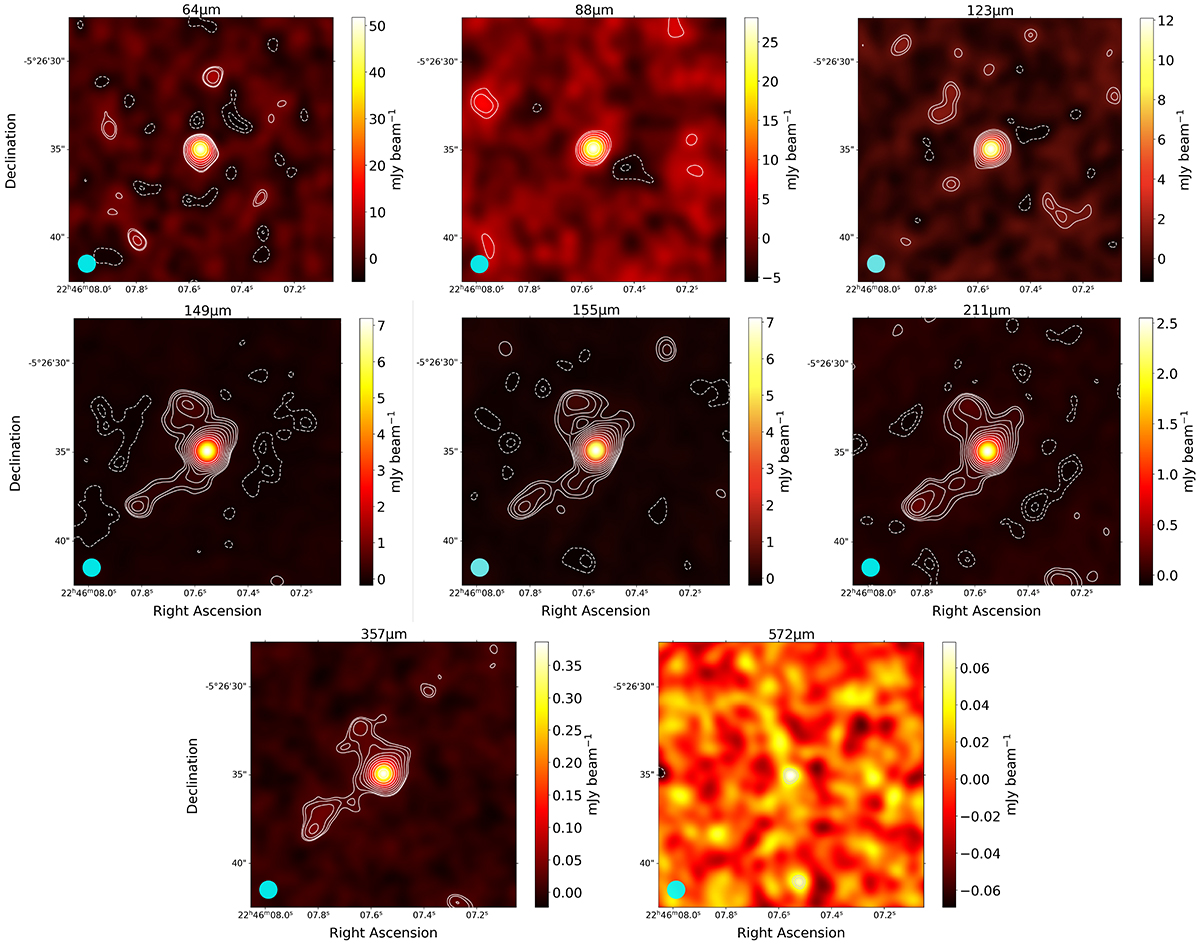
Download original image
Intensity maps for the datasets of the W2246–0526 merging system. The central rest-frame wavelength of each continuum dataset is shown at the top of each panel, and the cyan circle in the bottom left of each panel represents the size of the ALMA beam (1″). The white solid contours indicate [3, 2n/2]×σ levels, with σ being the rms of the map, and n=[4,5,6,...]. The dashed contours show negative flux at the same absolute levels.
Current usage metrics show cumulative count of Article Views (full-text article views including HTML views, PDF and ePub downloads, according to the available data) and Abstracts Views on Vision4Press platform.
Data correspond to usage on the plateform after 2015. The current usage metrics is available 48-96 hours after online publication and is updated daily on week days.
Initial download of the metrics may take a while.