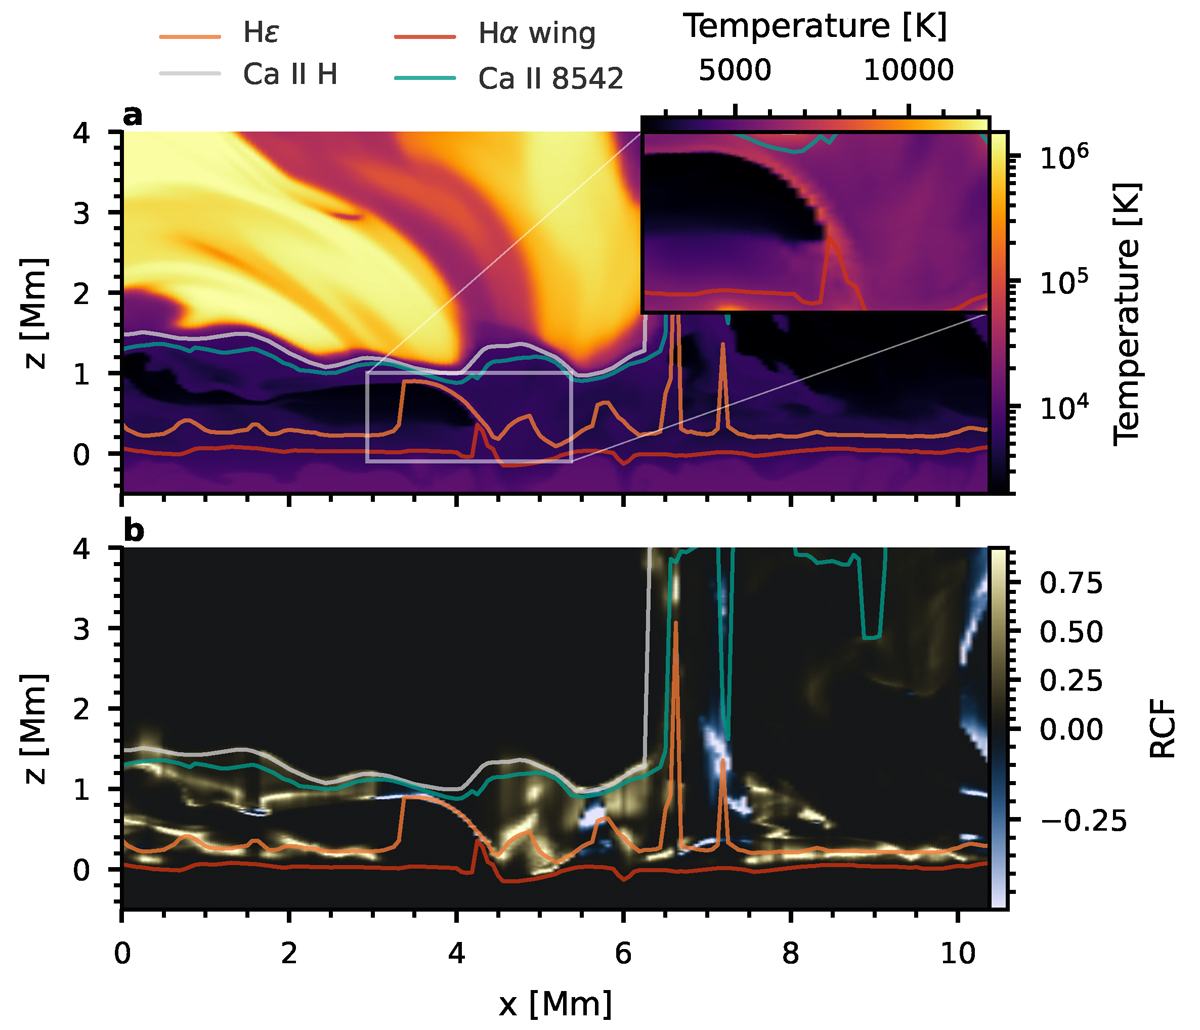
Fig. 4.
Download original image
Line formation through an Ellerman bomb. Panel a: Temperature slice across the atmosphere with h(τλ = 1) overplotted for the different line cores of Hε, Ca II H, and Ca II 854.2 nm and the wing of Hα at 656.35 nm. The inset shows a zoomed-in view around the Ellerman bomb, excluding h(τλ = 1) of Hε; there is a different temperature scale on top. Panel b: Relative contribution function at the maximum h(τλ = 1) over the Hε profile.
Current usage metrics show cumulative count of Article Views (full-text article views including HTML views, PDF and ePub downloads, according to the available data) and Abstracts Views on Vision4Press platform.
Data correspond to usage on the plateform after 2015. The current usage metrics is available 48-96 hours after online publication and is updated daily on week days.
Initial download of the metrics may take a while.