Fig. 13.
Download original image
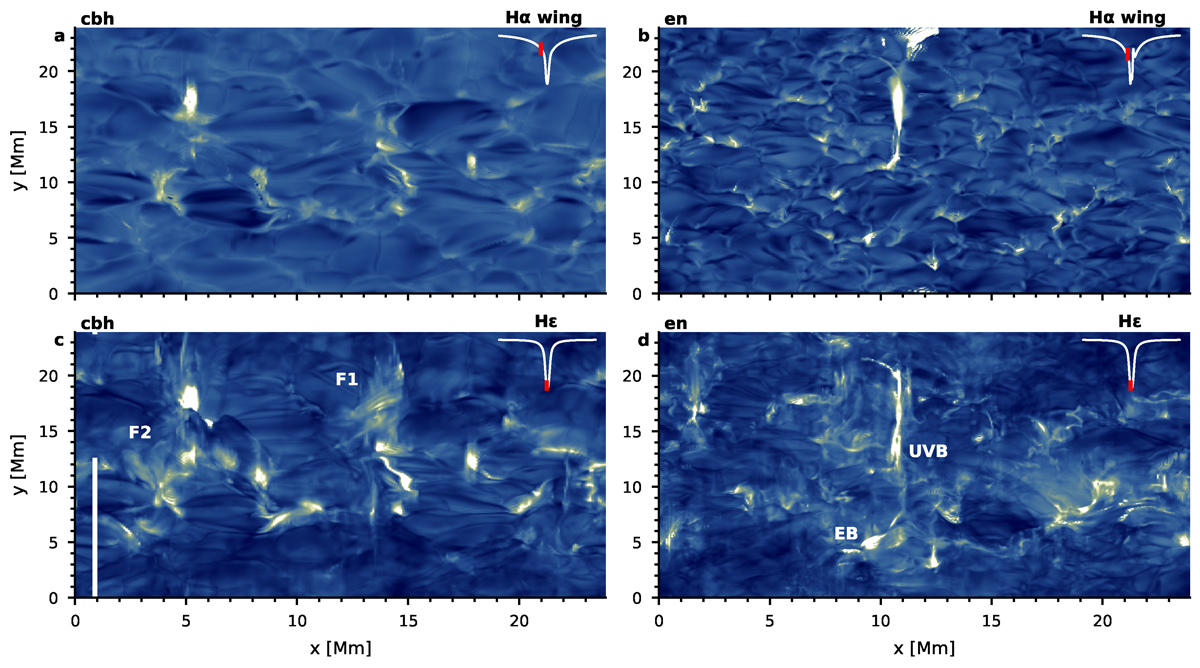
Synthetic Hα and Hε images at an heliocentric angle of μ = 0.5. Panels a and b show an Hα wing image for the cbh and en simulations. Panels c and d show an Hε line core image for the cbh and en simulations. The wavelength position of each image is indicated by a red vertical line on top of the averaged spectral profile at the top-right corner. The Hε images are a proxy for the line core emission and were calculated by neglecting the contribution of Ca II H.
Current usage metrics show cumulative count of Article Views (full-text article views including HTML views, PDF and ePub downloads, according to the available data) and Abstracts Views on Vision4Press platform.
Data correspond to usage on the plateform after 2015. The current usage metrics is available 48-96 hours after online publication and is updated daily on week days.
Initial download of the metrics may take a while.