Fig. 11.
Download original image
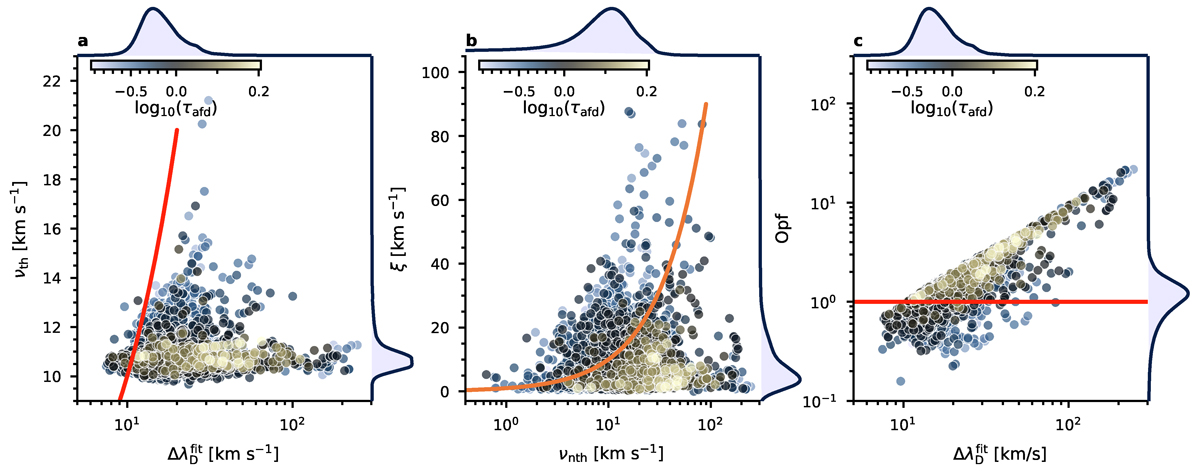
Correlations between different contributions to the Hε broadening. Panel a: Width of Hε (ΔλDfit, from a Gaussian fit) and thermal broadening (vth). Panel b: Nonthermal broadening (vnth) and nonthermal velocity (ξ). Panel c: Width of Hε (ΔλDfit) and the opacity broadening factor (Opf). The color of the points indicates if Hε is optically thin or thick, as shown by the color bar that shows log10(τafd). The probability density functions of the points, calculated using Gaussian kernel density estimation, are shown at the top and right of each panel. The solid lines in panels a and b denote the y = x curve.
Current usage metrics show cumulative count of Article Views (full-text article views including HTML views, PDF and ePub downloads, according to the available data) and Abstracts Views on Vision4Press platform.
Data correspond to usage on the plateform after 2015. The current usage metrics is available 48-96 hours after online publication and is updated daily on week days.
Initial download of the metrics may take a while.