Fig. 9
Download original image
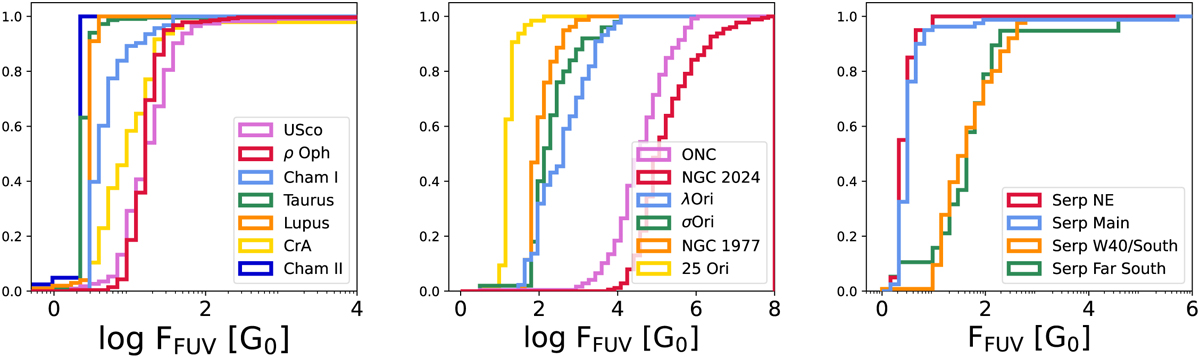
Cumulative distributions of the median FUV fluxes experienced by discs in the regions selected in ≲200 pc (left panel), Orion (central panel), and Serpens region (right panel). The flux values are the best estimate evaluated using Method 3 (Sect. 4.3). The exception is NGC 2024, where we evaluated the FUV fluxes using Method 2 (Sect. 4.2). We consider them as overestimates of the actual fluxes.
Current usage metrics show cumulative count of Article Views (full-text article views including HTML views, PDF and ePub downloads, according to the available data) and Abstracts Views on Vision4Press platform.
Data correspond to usage on the plateform after 2015. The current usage metrics is available 48-96 hours after online publication and is updated daily on week days.
Initial download of the metrics may take a while.