Fig. 8
Download original image
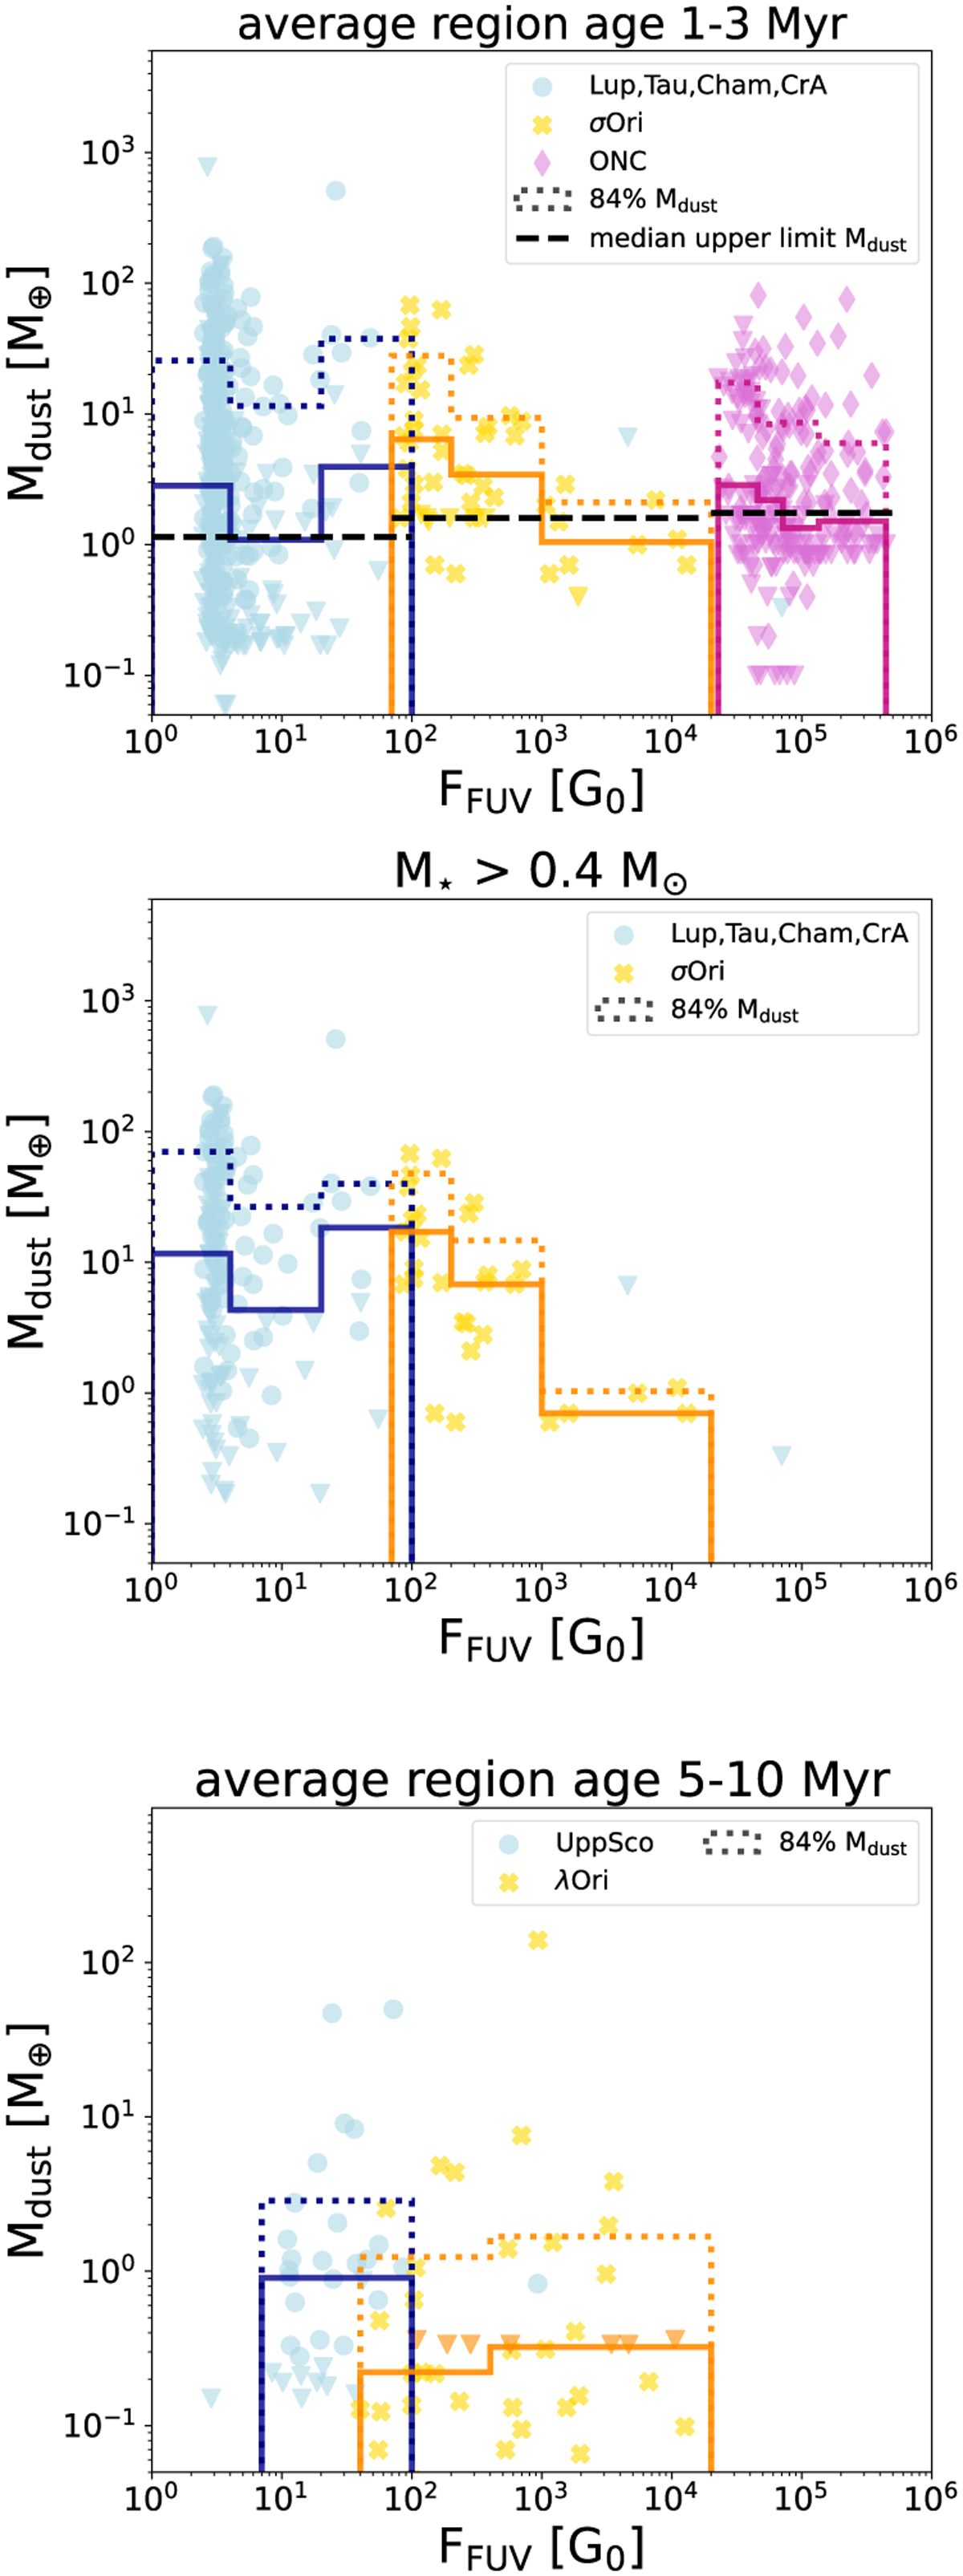
Dust disc masses and FUV fluxes for the regions with average age 1–3 Myr (top and central panel) and 5–10 Myr (bottom panel). The histograms show median dust disc masses in flux bins, including upper limits (shown as coloured triangles). The dotted histograms contain the 84% of the distributions. The top panel presents the median upper limit dust mass in each region as dashed black lines. The central panel only includes objects with a stellar mass >0.4 M⊙, and no upper limit in dust disc mass is present in σ Ori. The ONC is not included in this plot as the stellar mass is only defined for about one-third of the total disc sample.
Current usage metrics show cumulative count of Article Views (full-text article views including HTML views, PDF and ePub downloads, according to the available data) and Abstracts Views on Vision4Press platform.
Data correspond to usage on the plateform after 2015. The current usage metrics is available 48-96 hours after online publication and is updated daily on week days.
Initial download of the metrics may take a while.