Fig. 6
Download original image
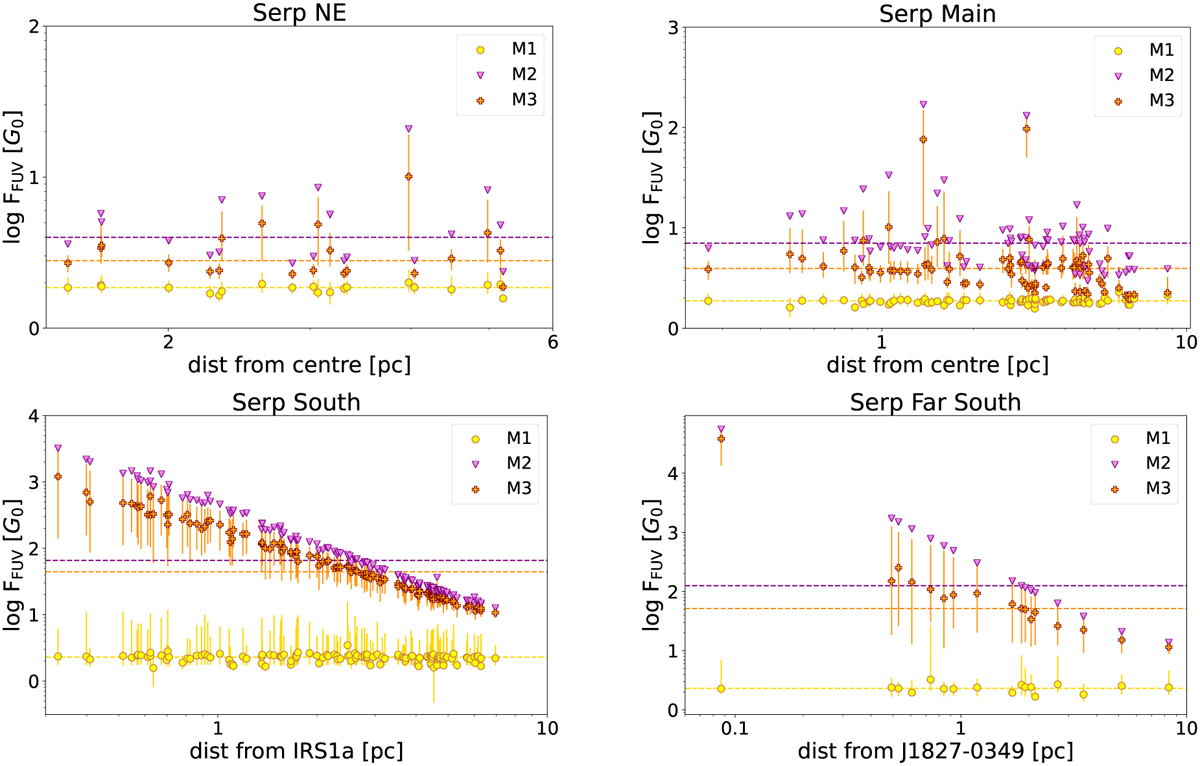
FUV flux experienced by discs in the Serpens region. Based on the sub-region in Serpens where they are located, the discs were divided into NE, Main, South, and the most southern part, Far South. Our flux estimates using Method 1, Method 2, and Method 3 (Sect. 4) are shown in yellow, purple, and orange, respectively. The lines show the median fluxes resulting from the three approaches. x-axis: Distance from the most massive star, or the centre of the region (if no strong dependence on the most massive star was found).
Current usage metrics show cumulative count of Article Views (full-text article views including HTML views, PDF and ePub downloads, according to the available data) and Abstracts Views on Vision4Press platform.
Data correspond to usage on the plateform after 2015. The current usage metrics is available 48-96 hours after online publication and is updated daily on week days.
Initial download of the metrics may take a while.