Fig. 5
Download original image
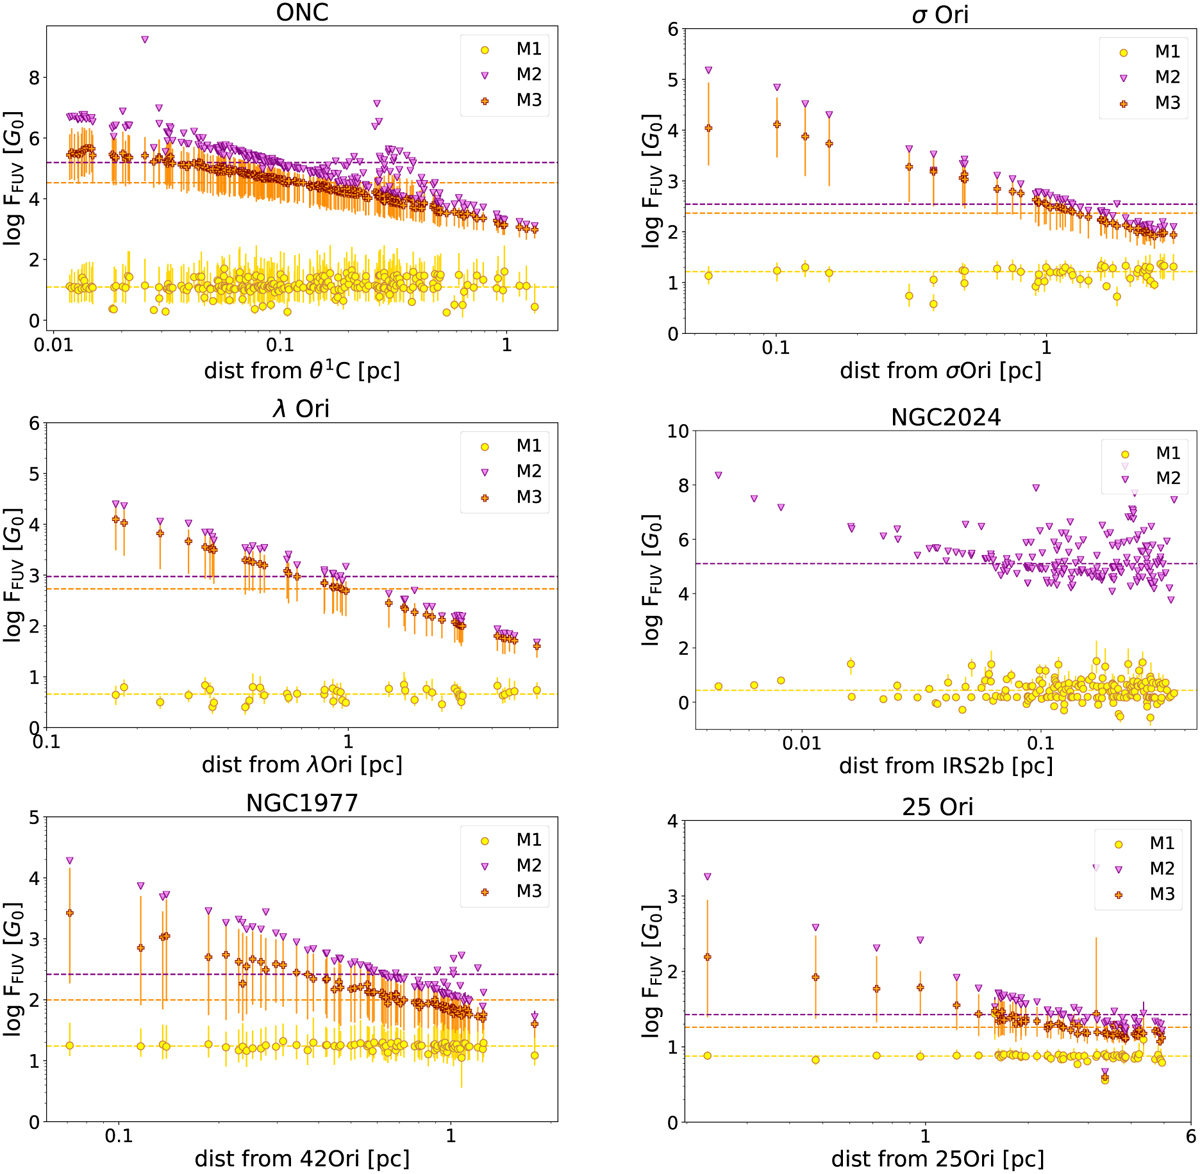
FUV fluxes experienced by discs in six star-forming regions in Orion. The different colours correspond to the different methods for the calculation of the FUV flux, as introduced in Sect. 4. The dashed lines show median FUV flux values for each region and for the calculation method. The x-axis contains the distance from the most massive star in the region. In NGC 2024, the local density distribution method cannot be applied (and therefore, no orange points lie in that panel), as an accurate density profile of the region cannot be currently retrieved.
Current usage metrics show cumulative count of Article Views (full-text article views including HTML views, PDF and ePub downloads, according to the available data) and Abstracts Views on Vision4Press platform.
Data correspond to usage on the plateform after 2015. The current usage metrics is available 48-96 hours after online publication and is updated daily on week days.
Initial download of the metrics may take a while.