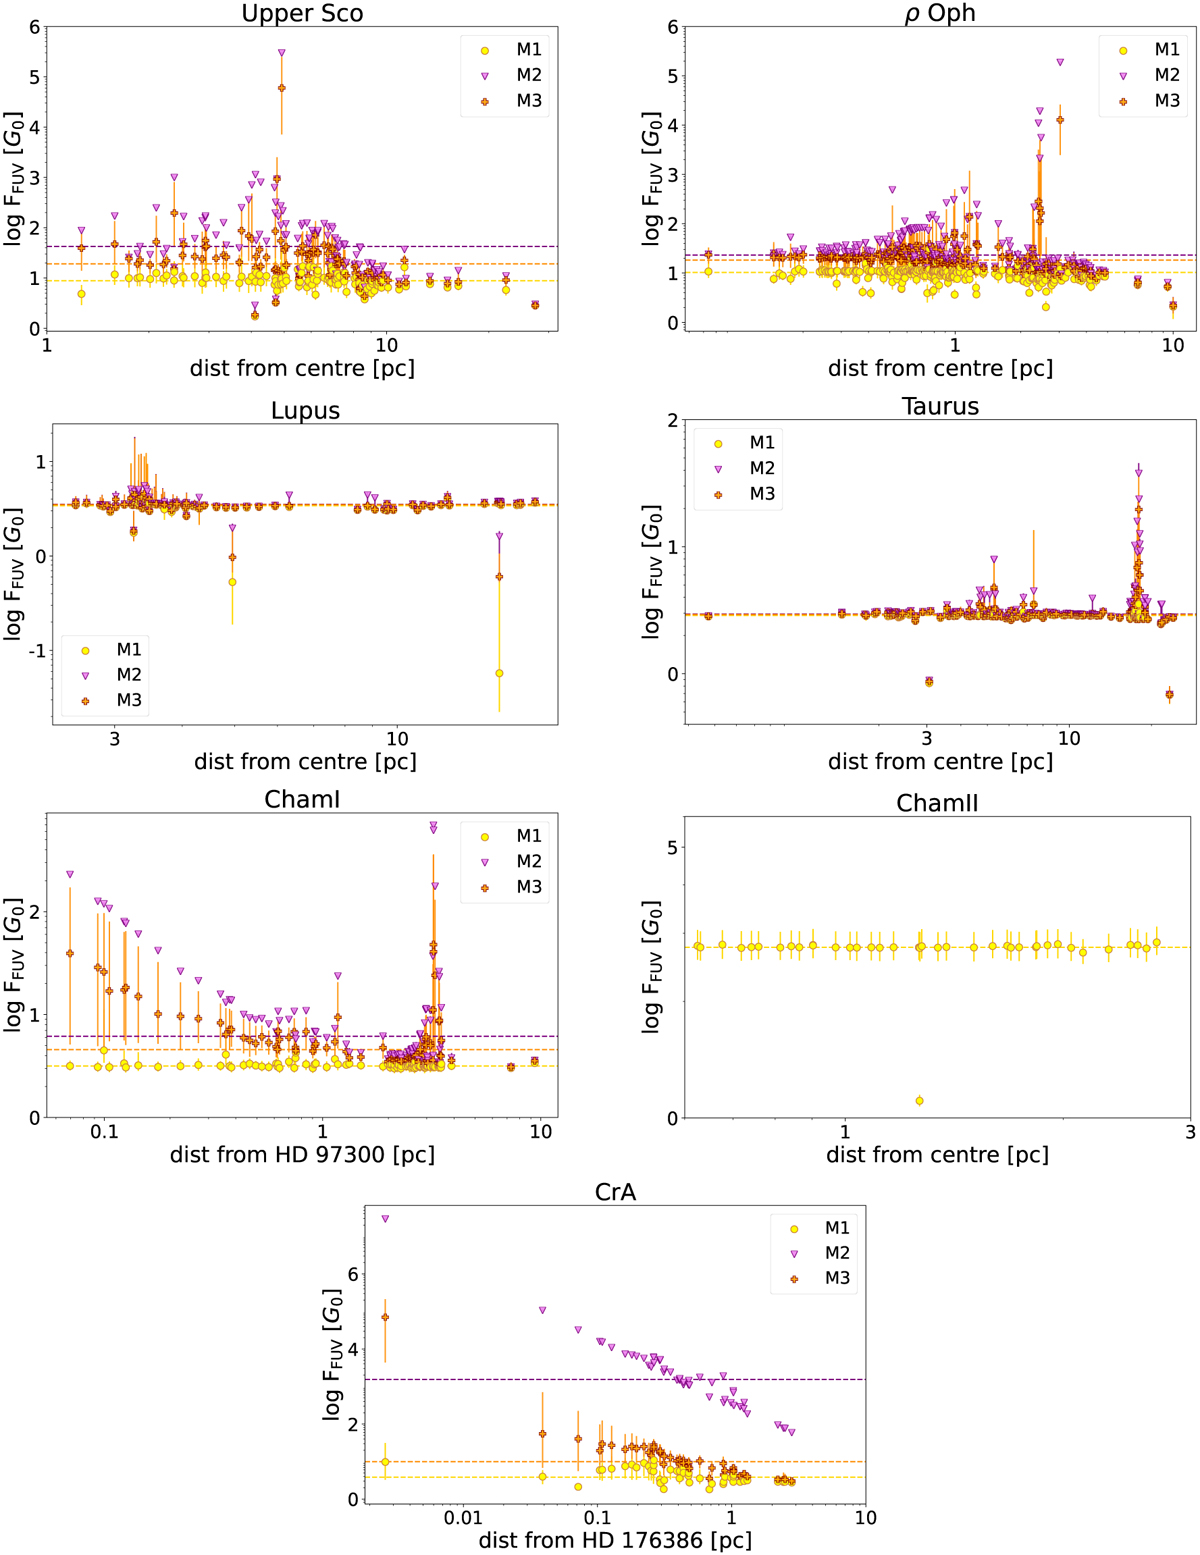
Fig. 4
Download original image
FUV flux experienced by discs in seven regions located ≲200 pc from the Sun. The three approaches we used to evaluate the FUV flux are presented in yellow (Method 1), purple (Method 2), and orange (Method 3). The dashed lines show the median FUV flux value for each calculation method and region. x-axis: Distance from the most massive star, or the centre of the region (when the distribution of OBA stars, and therefore FUV fluxes, is approximately uniform in the region).
Current usage metrics show cumulative count of Article Views (full-text article views including HTML views, PDF and ePub downloads, according to the available data) and Abstracts Views on Vision4Press platform.
Data correspond to usage on the plateform after 2015. The current usage metrics is available 48-96 hours after online publication and is updated daily on week days.
Initial download of the metrics may take a while.