Open Access
Fig. D.1
Download original image
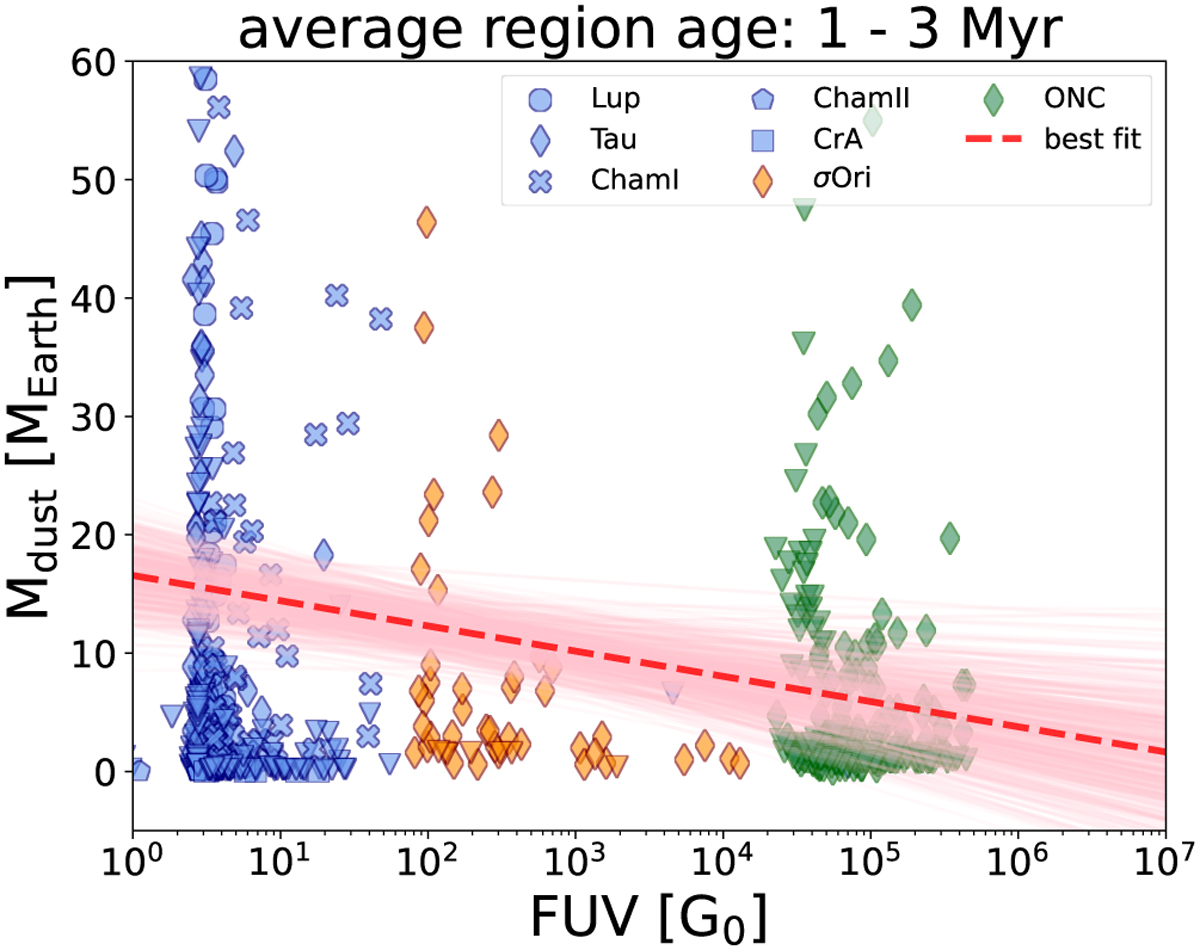
Tentative correlation between disc dust masses, and FUV flux best estimate in regions with average age 1–3 Myr. Triangles indicate upper limit dust disc masses. Uncertainties in masses and flux, and upper limits, are included in the derivation of the best fit model and not displayed for more clarity in the figure.
Current usage metrics show cumulative count of Article Views (full-text article views including HTML views, PDF and ePub downloads, according to the available data) and Abstracts Views on Vision4Press platform.
Data correspond to usage on the plateform after 2015. The current usage metrics is available 48-96 hours after online publication and is updated daily on week days.
Initial download of the metrics may take a while.