Open Access
Fig. 9
Download original image
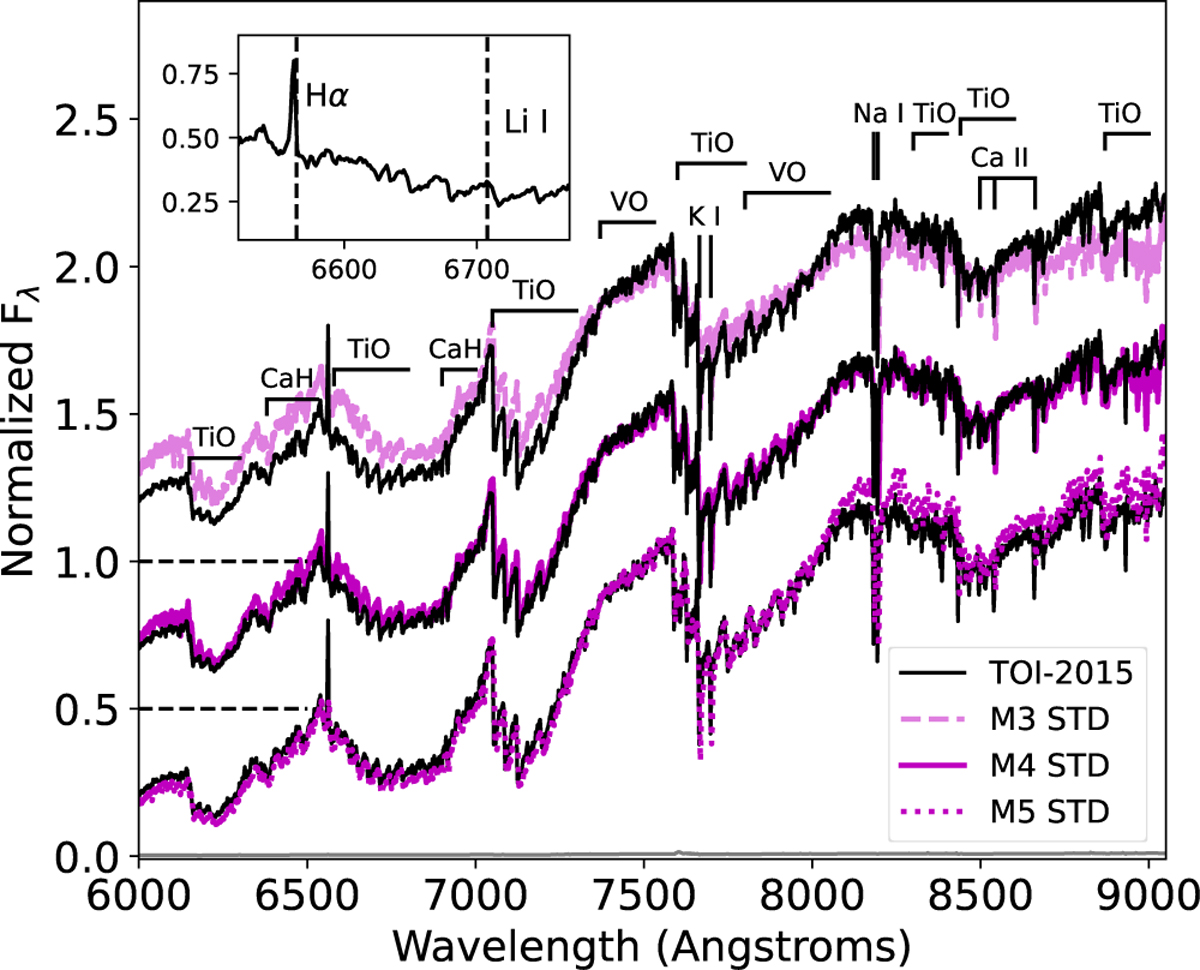
Normalized Shane/Kast optical spectrum of TOI-2015 (black lines) compared to three SDSS spectral templates from Bochanski et al. (2007, magenta lines). Characteristic spectral features of mid-type M dwarfs are labeled. The inset box shows the 6520–6770 Å region encompassing Hα (in emission) and Li I (not detected).
Current usage metrics show cumulative count of Article Views (full-text article views including HTML views, PDF and ePub downloads, according to the available data) and Abstracts Views on Vision4Press platform.
Data correspond to usage on the plateform after 2015. The current usage metrics is available 48-96 hours after online publication and is updated daily on week days.
Initial download of the metrics may take a while.