Fig. 15
Download original image
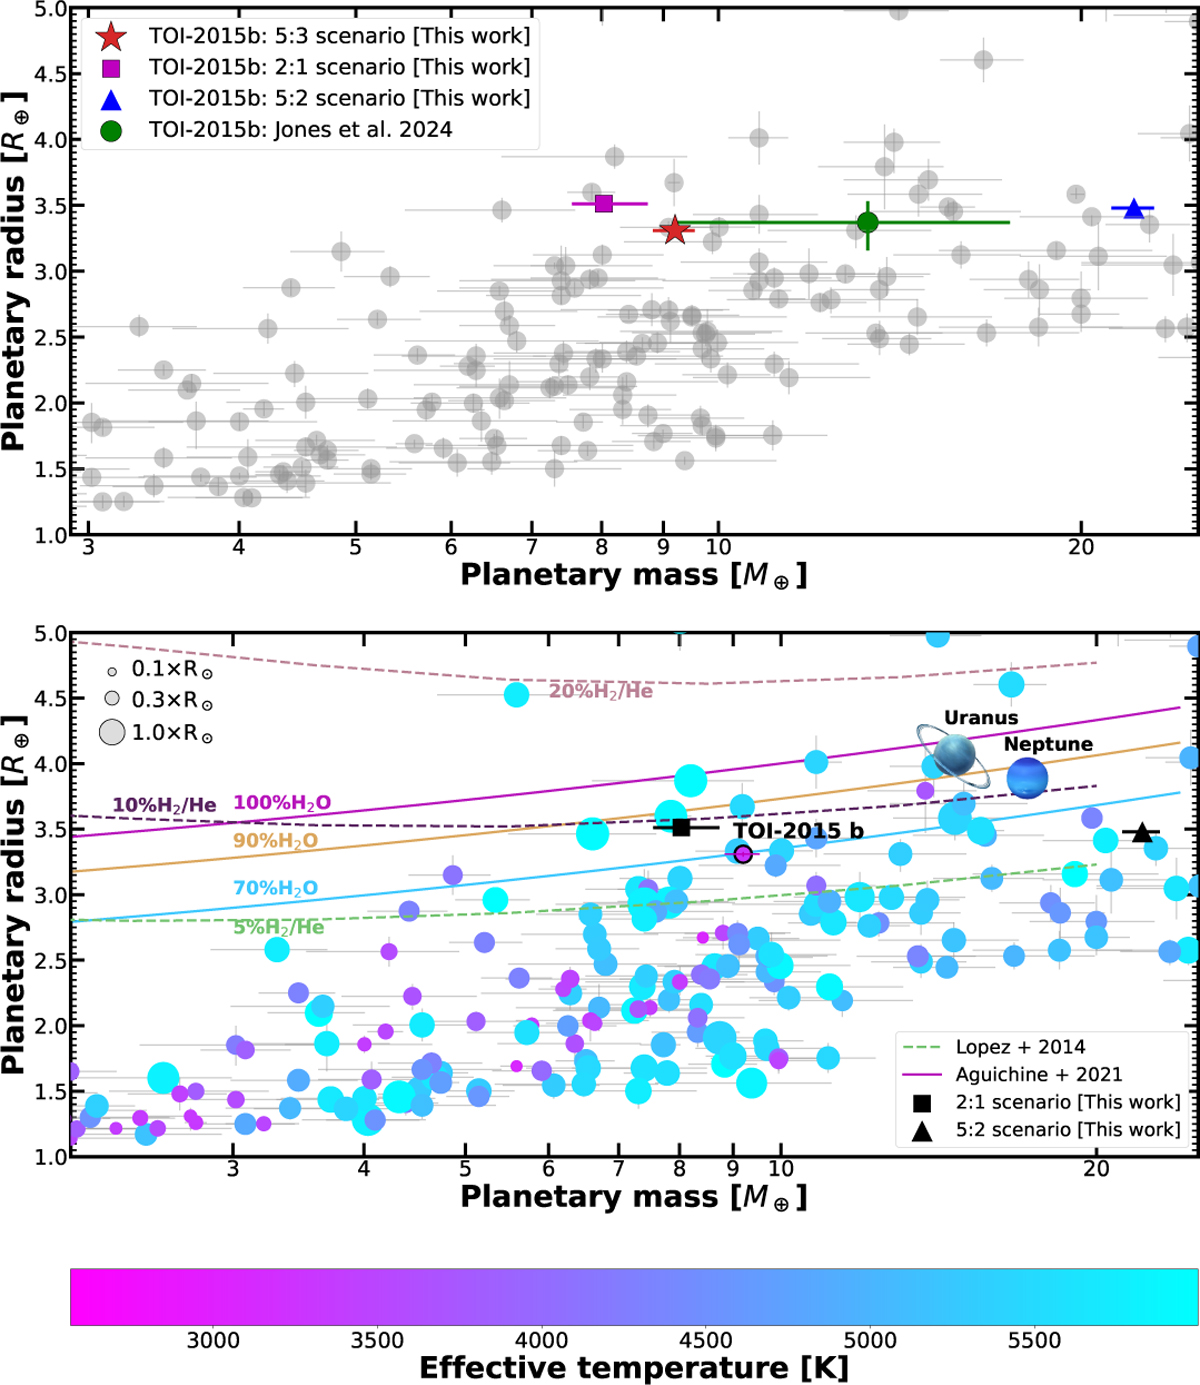
Planetary radius as function of planetary mass of known transiting exoplanets well characterized, with radius and mass precisions better than 10% and 20%, respectively. Data are extracted from TEPCat (Southworth 2011). Top panel shows the comparison between the planetary parameters for TOI-2015 b. The red star shows our updated measurements, while the green dot with error bars shows the planetary parameters derived by Jones et al. (2024). We also highlighted the planetary parameters for other scenarios 2:1 (magenta square) and 5:2 (blue triangle). Bottom panel shows the comparison between TOI-2015 b to other transiting planetary systems. The systems are colored according to the stellar effective temperature. The size of the points is scaled according to the stellar radius. Dashed lines show the massradius composition models from Lopez & Fortney (2014). We display mass-radius curves for hydrogen-helium compositions of 5%, 10% and 20% H2/He. We assumed a planet with an incident flux of S p = 10 S⊕, and an age of > 1 Gyr. The solid lines present the mass-radius composition models from Aguichine et al. (2021). We display mass-radius curves for water-rich compositions of 70%, 90% and 100% H2O. We assumed a planetary equilibrium temperature of Teq = 500K and a core mass fraction of xcore = 0.3. We also highlighted the planetary parameters for other scenarios 2:1 (black square) and 5:2 (black triangle). Two Solar System planets (Uranus and Neptune) are also displayed.
Current usage metrics show cumulative count of Article Views (full-text article views including HTML views, PDF and ePub downloads, according to the available data) and Abstracts Views on Vision4Press platform.
Data correspond to usage on the plateform after 2015. The current usage metrics is available 48-96 hours after online publication and is updated daily on week days.
Initial download of the metrics may take a while.