Fig. 10
Download original image
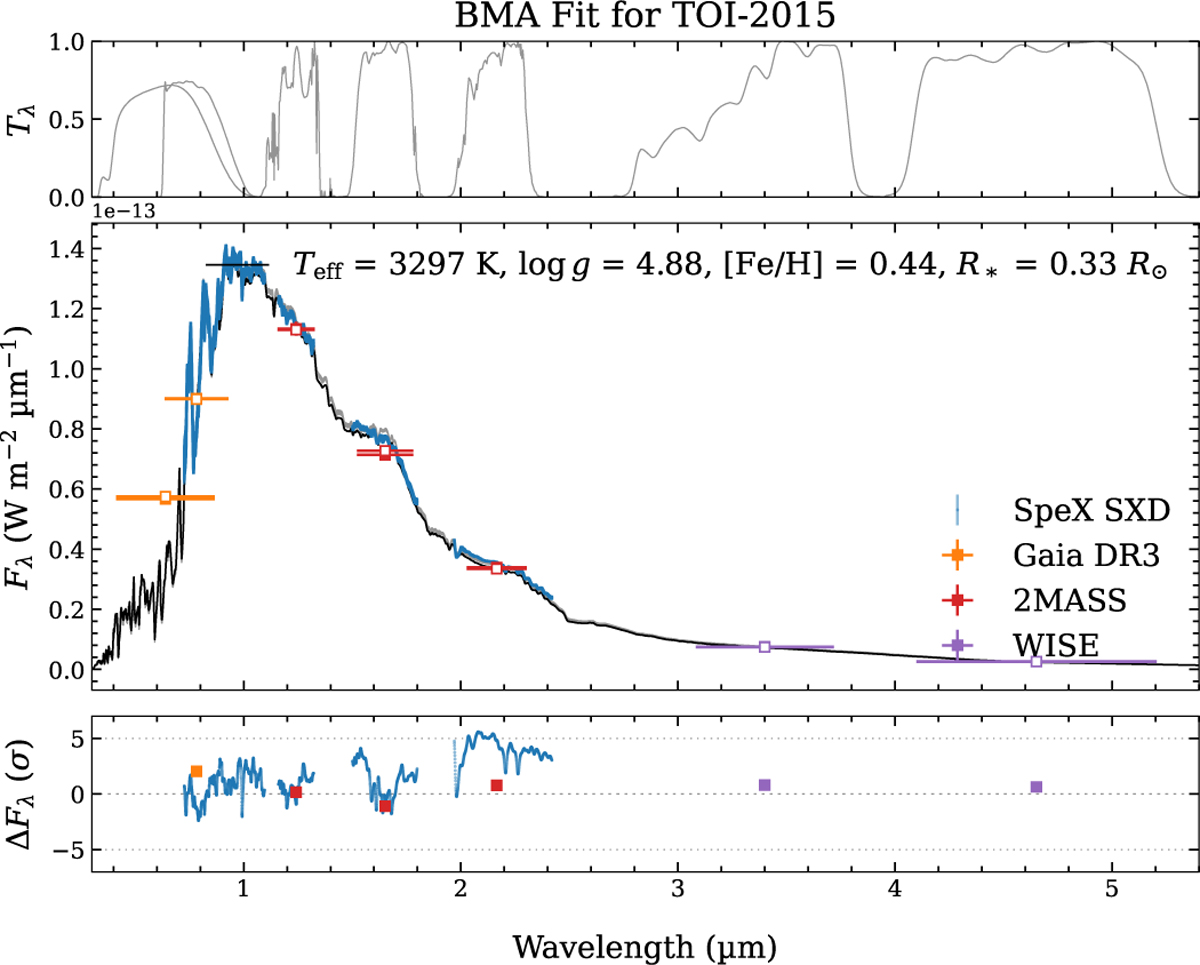
Bayesian Model Averaging (BMA) fit for TOI-2015. The top panel shows the transmission curves of the filters considered, and the bottom panel displays the residuals. The observed SpeX SXD spectrum is shown in blue, while the black line represents the BT-Settl CIFIST synthetic spectrum using the BMA-derived stellar parameters, as shown in Table 1. The fluxes related to the photometry are shown by colors: orange for Gaia DR3, red for 2MASS, and purple for WISE.
Current usage metrics show cumulative count of Article Views (full-text article views including HTML views, PDF and ePub downloads, according to the available data) and Abstracts Views on Vision4Press platform.
Data correspond to usage on the plateform after 2015. The current usage metrics is available 48-96 hours after online publication and is updated daily on week days.
Initial download of the metrics may take a while.