Fig. E.2.
Download original image
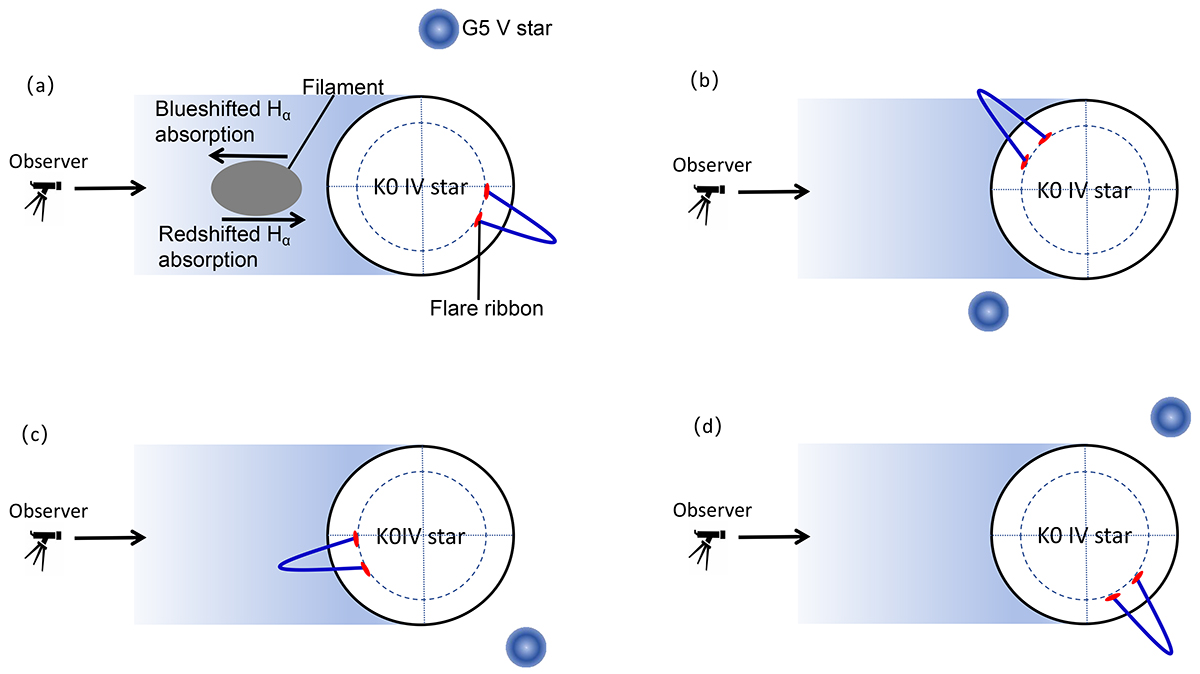
Schematic diagram that expresses the interpretation of the Doppler-shifted excess absorptions and the possible flaring location. Panel (a) represents the occurrence of the Doppler-shifted absorption features observed on 2017 December 28 and the flaring location at that time. Panels (b), (c), and (d) depict the possible flaring location on 2017 December 31, 2018 January 1, and 2018 January 3, respectively. The dashed circles represent the latitude of 50°. The small telescope illustration is from Fig. 7 in Inoue et al. (2023).
Current usage metrics show cumulative count of Article Views (full-text article views including HTML views, PDF and ePub downloads, according to the available data) and Abstracts Views on Vision4Press platform.
Data correspond to usage on the plateform after 2015. The current usage metrics is available 48-96 hours after online publication and is updated daily on week days.
Initial download of the metrics may take a while.