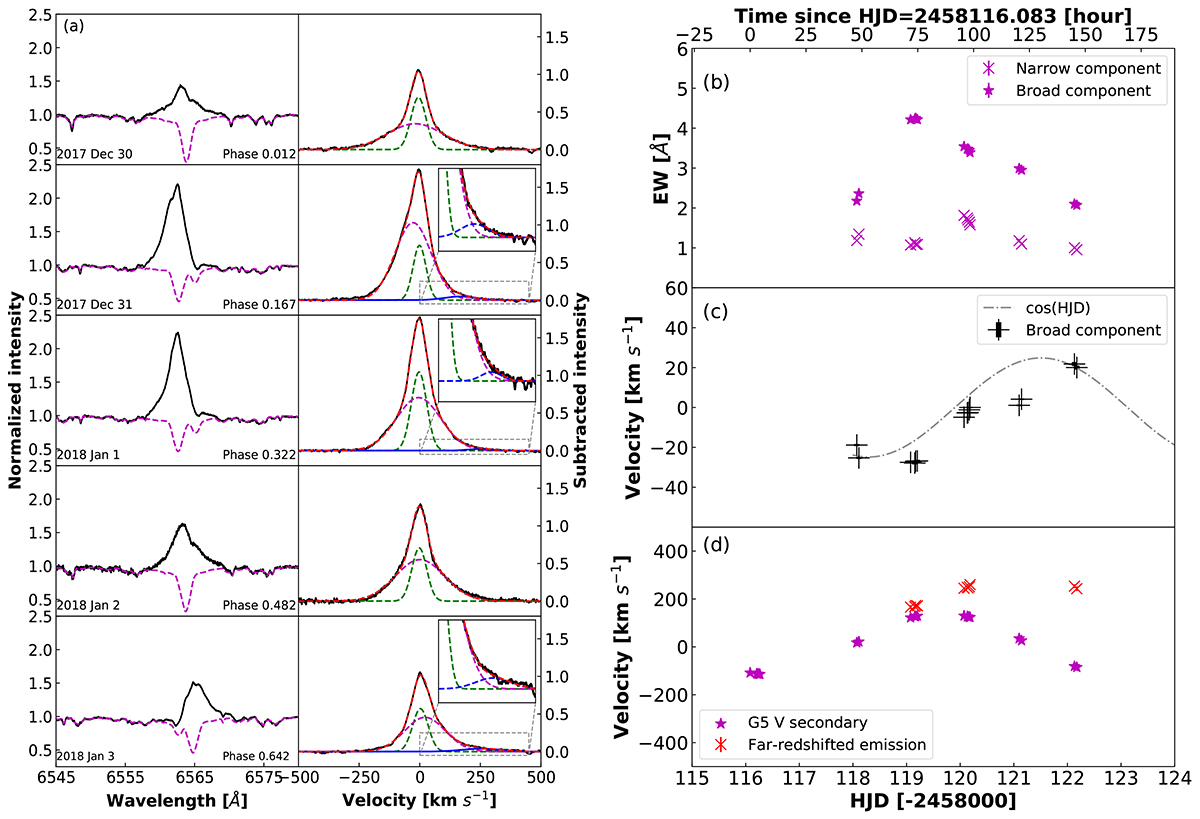
Fig. E.1.
Download original image
Hα spectra from 2017 December 30 to 2018 January 3. (a) Examples of Gaussian fitting for the Hα subtractions. Left part: Observed (black solid lines) and synthesized (magenta dashed lines) Hα spectra. The observing dates and phases are also marked. Right part: Gaussian fitting (colored dashed lines) for the Hα subtractions (black solid lines). All subtracted spectra are corrected to the rest velocity frame of the K0 IV primary star of UX Ari. The insets show zoomed-in images of the spectral ranges with the far-redshifted emission components. (b) Temporal variations of the EWs of the narrow and broad emission components. (c) Temporal variations of the velocities of the broad emission component and the fitting line. (d) Temporal variations of the velocities of the far-redshifted emission component and the G5 V secondary component relative to the K0 IV primary component.
Current usage metrics show cumulative count of Article Views (full-text article views including HTML views, PDF and ePub downloads, according to the available data) and Abstracts Views on Vision4Press platform.
Data correspond to usage on the plateform after 2015. The current usage metrics is available 48-96 hours after online publication and is updated daily on week days.
Initial download of the metrics may take a while.