Fig. 3.
Download original image
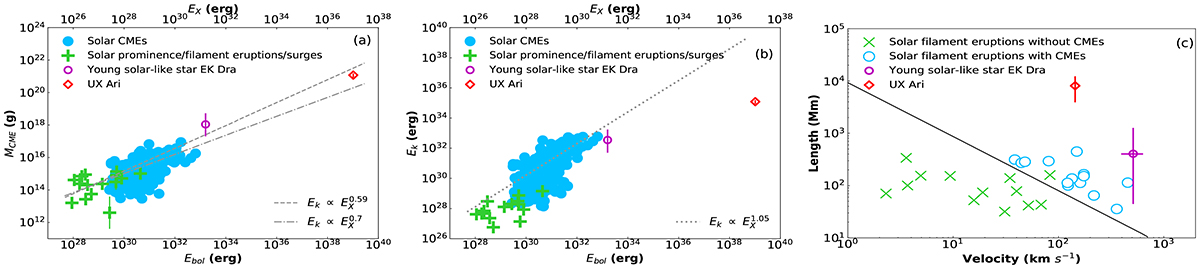
Mass MCME (a) and kinetic energy Ek (b) plotted as functions of flaring bolometric energy (bottom horizontal axis) and X-ray energy emitted in the GOES band (top axis) for solar and stellar filament and prominence eruptions and CMEs. The solar CME data (filled sky-blue circles) are derived from Yashiro & Gopalswamy (2009). The solar prominence and filament eruptions and surges (green plus signs) are from Namekata et al. (2024), originally taken from Namekata et al. (2021) and Kotani et al. (2023). The dashed and dotted lines are trend fits for the solar CMEs expressed as ![]() and Ek ∝ E1.05 (Drake et al. 2013) and
and Ek ∝ E1.05 (Drake et al. 2013) and ![]() (Aarnio et al. 2012). (c) Comparison between the velocity and length scales of the filament eruptions on the Sun and UX Ari. The solid black line indicates a threshold (see Seki et al. 2021).
(Aarnio et al. 2012). (c) Comparison between the velocity and length scales of the filament eruptions on the Sun and UX Ari. The solid black line indicates a threshold (see Seki et al. 2021).
Current usage metrics show cumulative count of Article Views (full-text article views including HTML views, PDF and ePub downloads, according to the available data) and Abstracts Views on Vision4Press platform.
Data correspond to usage on the plateform after 2015. The current usage metrics is available 48-96 hours after online publication and is updated daily on week days.
Initial download of the metrics may take a while.