Fig. 2.
Download original image
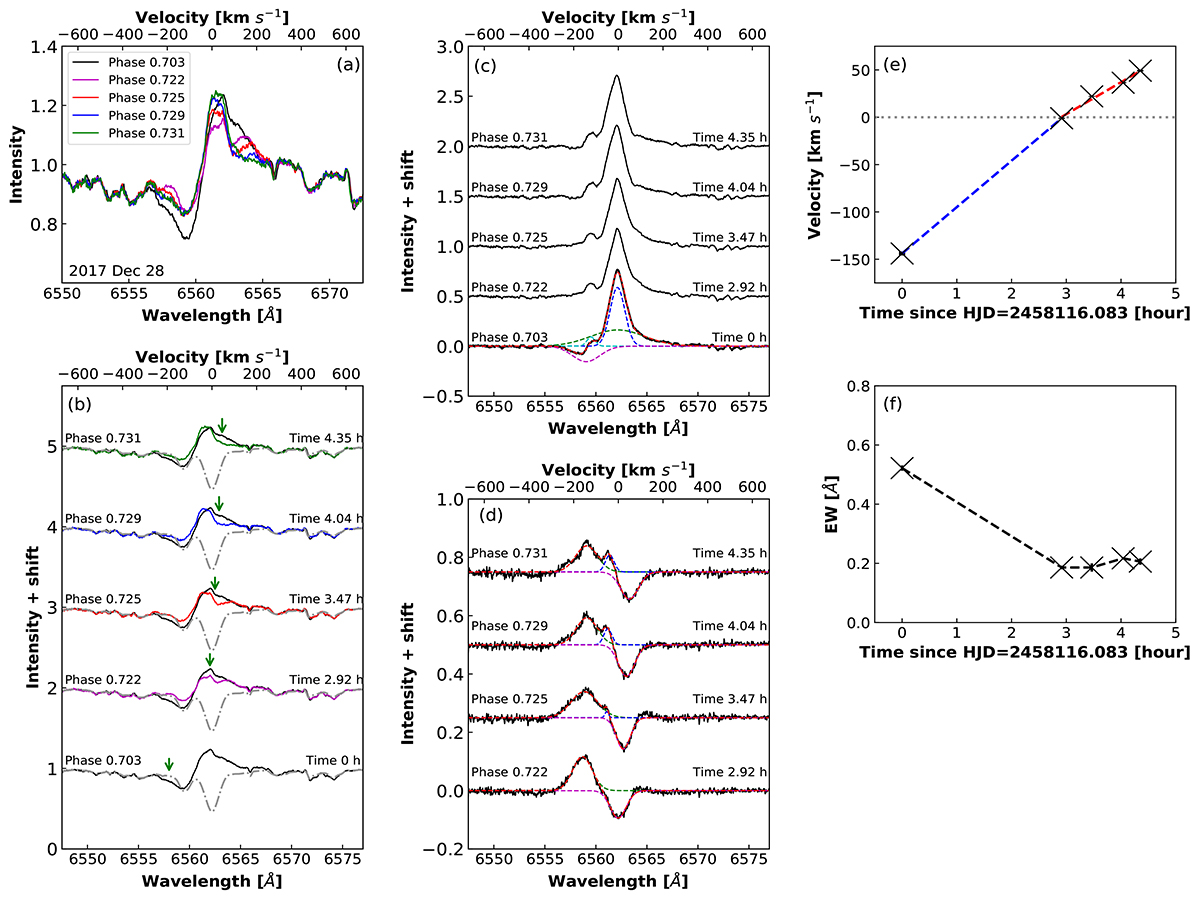
Hα spectra on 2017 December 28 and Doppler-shifted absorption features in the profiles. (a) Observed Hα spectra overlaid for comparison. (b) Observed (solid lines) and synthesized (dash-dotted gray lines) Hα spectra. For the last four observed spectra (solid colored lines), the first observed spectrum is superimposed for comparison. Arrows indicate the absorption features that appeared in the Hα profiles. (c) Subtracted Hα profiles and Gaussian fitting (dashed lines) for the subtraction at phase 0.703. (d) Differences between the first observed Hα spectrum and the subsequent four observed spectra (black solid lines), together with the Gaussian fittings (dashed lines). Phases and flare times are indicated in the panels, and all spectra are corrected to the rest velocity frame of the K0 IV primary star of UX Ari. (e) Temporal variation of the bulk velocities of the absorption feature. The blue and red dashed lines represent the linear fittings for the blueshifted and redshifted velocities, respectively. The gray dotted line indicates the zero-point of the velocity. (f) Temporal variation of the EWs of the absorption feature.
Current usage metrics show cumulative count of Article Views (full-text article views including HTML views, PDF and ePub downloads, according to the available data) and Abstracts Views on Vision4Press platform.
Data correspond to usage on the plateform after 2015. The current usage metrics is available 48-96 hours after online publication and is updated daily on week days.
Initial download of the metrics may take a while.