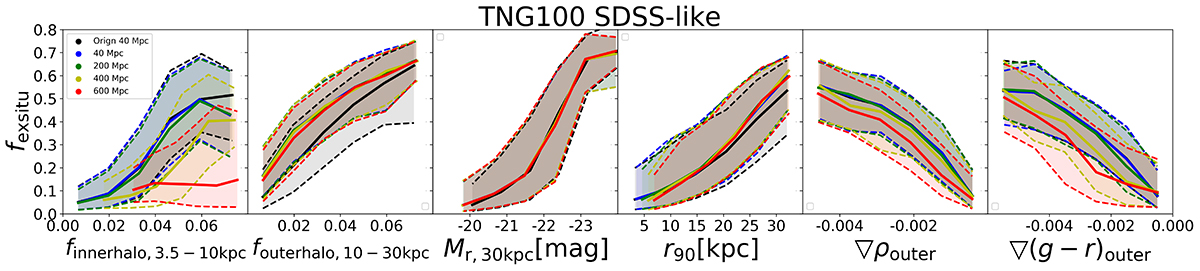
Fig. 7.
Download original image
Parameters derived from mock images vs. fexsitu for galaxies placed at different distances and with SDSS-like observations. In each panel the black curve represents galaxies at 40 Mpc and without observational noise; the blue, green, yellow, and red curves represent galaxies with observational noise and placed at 40, 200, 400, and 600, respectively. The solid curves are running median and the dashed curves are ±1σ scatter.
Current usage metrics show cumulative count of Article Views (full-text article views including HTML views, PDF and ePub downloads, according to the available data) and Abstracts Views on Vision4Press platform.
Data correspond to usage on the plateform after 2015. The current usage metrics is available 48-96 hours after online publication and is updated daily on week days.
Initial download of the metrics may take a while.