Fig. 6.
Download original image
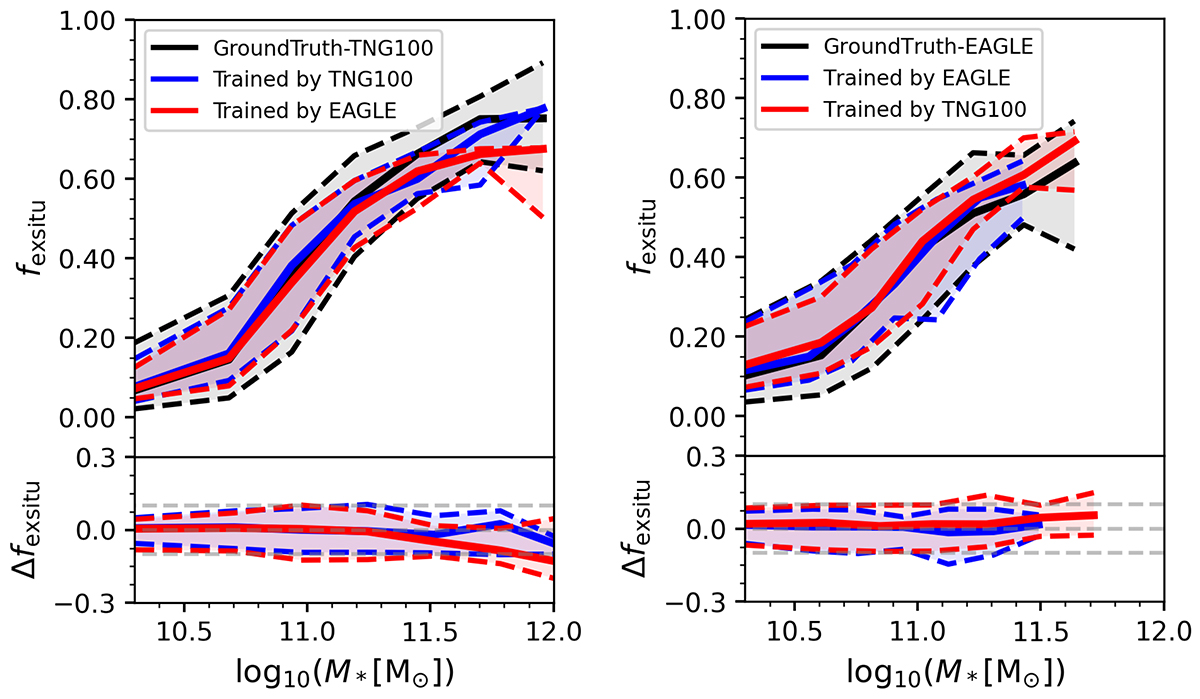
fexsitu as a function of stellar mass for model predications vs. ground truth. In the left panel the black solid curve is the median of the ground truth for the TNG100 galaxies; the blue and red solid curves represent those predicted by Model A (trained by TNG100) and Model C (trained by EAGLE); and the dashed curves are the ±1σ scatter. In the right panel the black curves are the ground truth for EAGLE galaxies; the blue and red represent those predicted by Model B (trained by EAGLE) and Model D (trained by TNG100).
Current usage metrics show cumulative count of Article Views (full-text article views including HTML views, PDF and ePub downloads, according to the available data) and Abstracts Views on Vision4Press platform.
Data correspond to usage on the plateform after 2015. The current usage metrics is available 48-96 hours after online publication and is updated daily on week days.
Initial download of the metrics may take a while.