Fig. 5.
Download original image
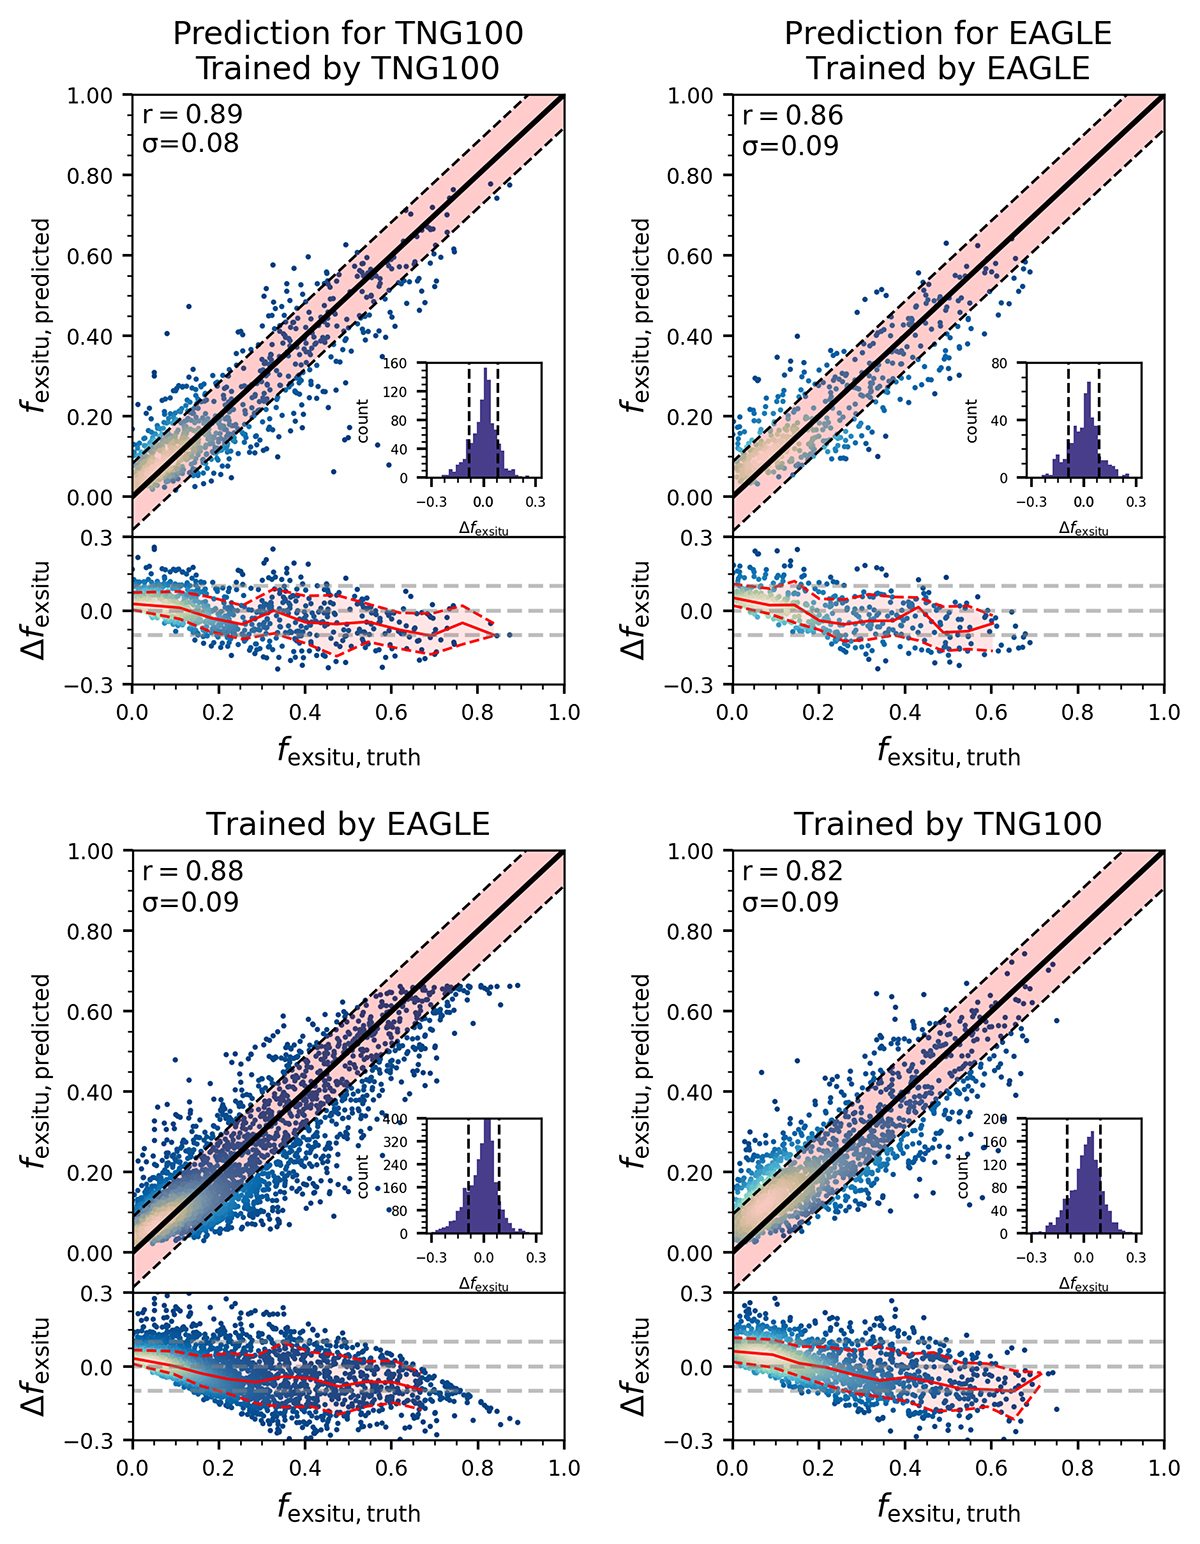
Model predicted fexsitu vs. the ground truth. The different panels are models trained and validated by TNG100 and EAGLE in the top, and cross-validated with each other in the bottom, all with the combined parameters Sub0. For each column we show the one-to-one comparison in the top panel: r is ![]() ; σ(Δfexsitu) is the scatter of residual Δfexsitu = fexsitu, predicted − fexsitu, truth; the solid black line marks y = x; and the dashed black line represents ±1σ(Δfexsitu) scatter. The insets show the histogram of Δfexsitu. In the bottom panel, we show the residual Δfexsitu as a function of galaxy fexsitu, truth: the red solid and dashed curves respectively show the running median and ±σ(Δfexsitu) scatter.
; σ(Δfexsitu) is the scatter of residual Δfexsitu = fexsitu, predicted − fexsitu, truth; the solid black line marks y = x; and the dashed black line represents ±1σ(Δfexsitu) scatter. The insets show the histogram of Δfexsitu. In the bottom panel, we show the residual Δfexsitu as a function of galaxy fexsitu, truth: the red solid and dashed curves respectively show the running median and ±σ(Δfexsitu) scatter.
Current usage metrics show cumulative count of Article Views (full-text article views including HTML views, PDF and ePub downloads, according to the available data) and Abstracts Views on Vision4Press platform.
Data correspond to usage on the plateform after 2015. The current usage metrics is available 48-96 hours after online publication and is updated daily on week days.
Initial download of the metrics may take a while.