Fig. 3.
Download original image
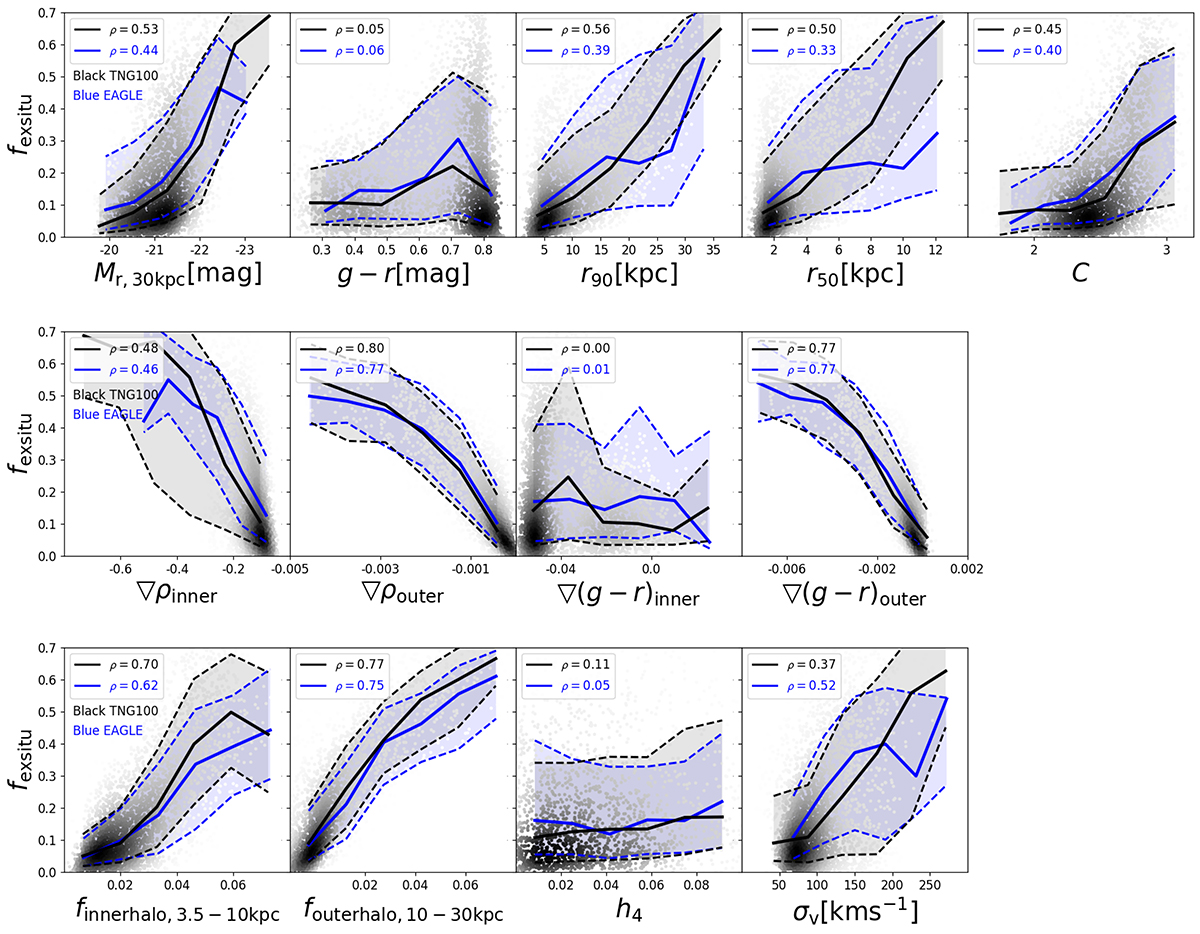
Correlations between the parameters extracted from mock SDSS photometric observations for galaxies at 40 Mpc and the ex situ stellar mass fraction of galaxies. The grey dots are TNG100 galaxies; the black solid and dashed curves are the running median and the ±1σ scatter of the TNG100 galaxies. The blue symbols are for EAGLE galaxies. The Spearman’s rank coefficient(ρ) of each correlation is labelled in the figure.
Current usage metrics show cumulative count of Article Views (full-text article views including HTML views, PDF and ePub downloads, according to the available data) and Abstracts Views on Vision4Press platform.
Data correspond to usage on the plateform after 2015. The current usage metrics is available 48-96 hours after online publication and is updated daily on week days.
Initial download of the metrics may take a while.