Fig. 2.
Download original image
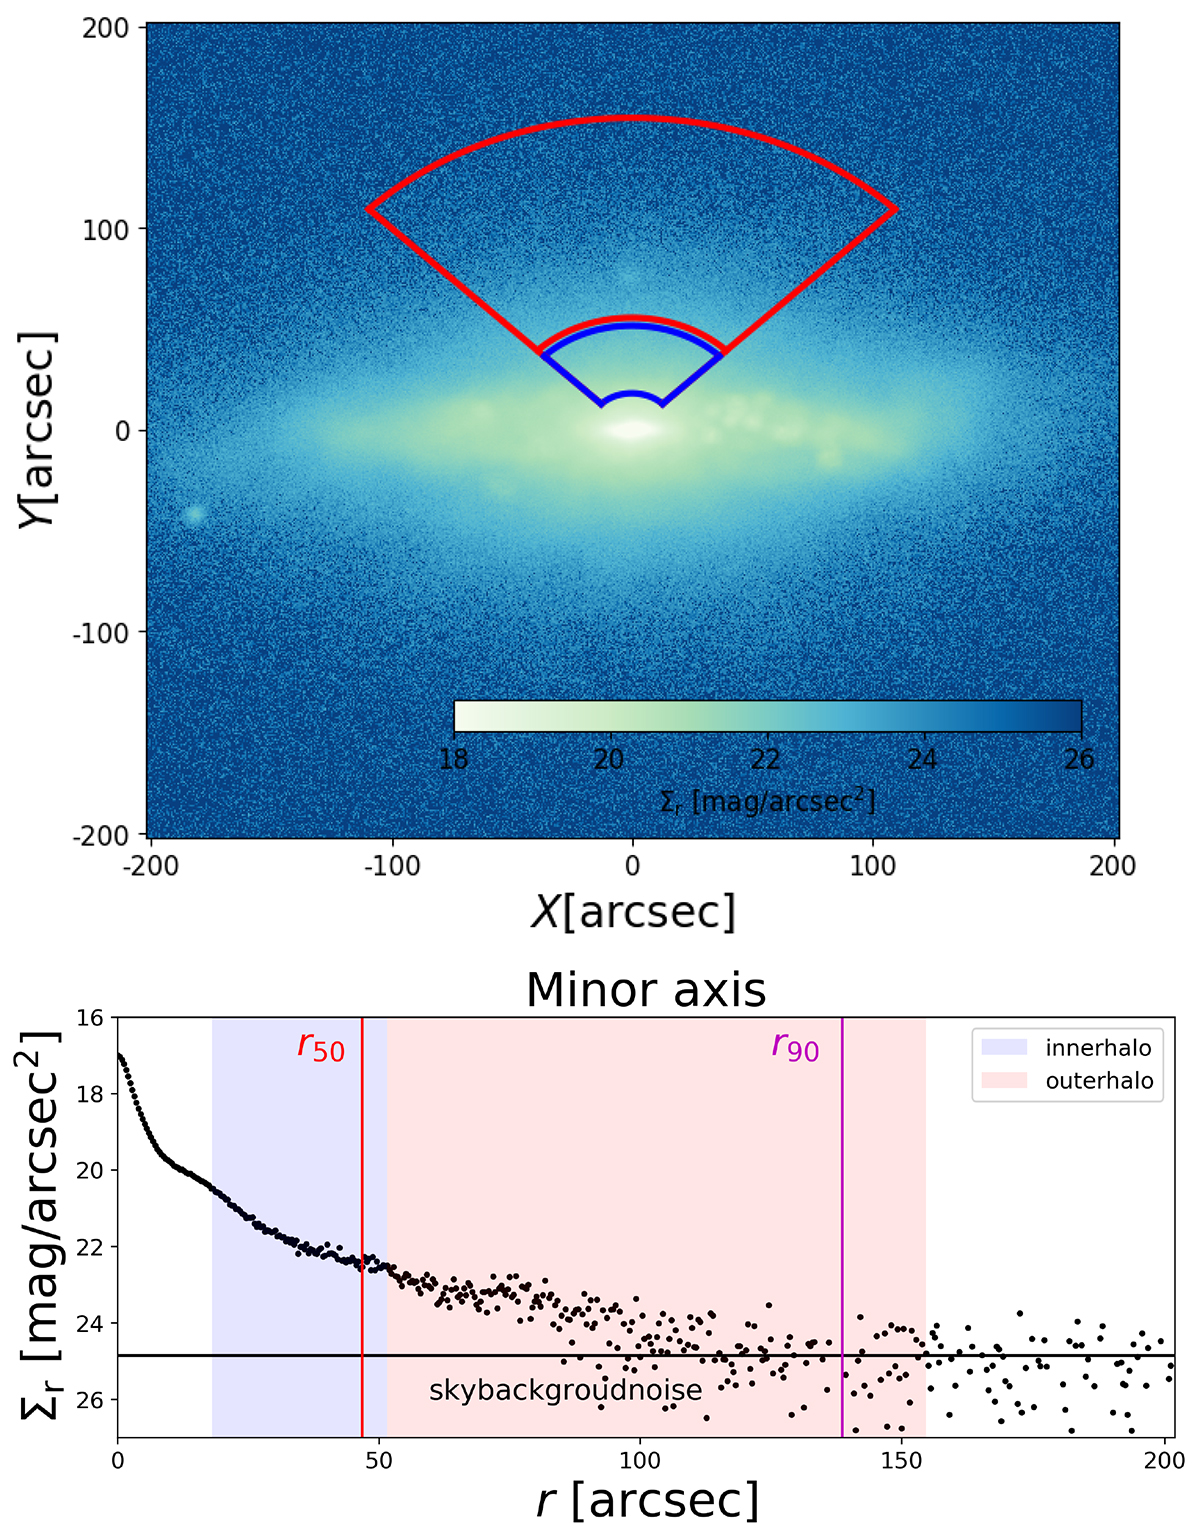
SDSS-like r-band image created from a TNG100 galaxy subhalo 6 at z = 0 projected near edge-on, and placed at the distance of 40 Mpc. Top: 2D image. The sector enclosed by blue is defined as the inner halo (3.5 kpc–10 kpc) and that in red as the outer halo (10 kpc–30 kpc). Bottom: surface brightness profile along the minor axis. The black horizontal line indicates the background noise of the sky Σr, 0; the red and magenta vertical lines mark r50 and r90 obtained from the Petrosian radius.
Current usage metrics show cumulative count of Article Views (full-text article views including HTML views, PDF and ePub downloads, according to the available data) and Abstracts Views on Vision4Press platform.
Data correspond to usage on the plateform after 2015. The current usage metrics is available 48-96 hours after online publication and is updated daily on week days.
Initial download of the metrics may take a while.