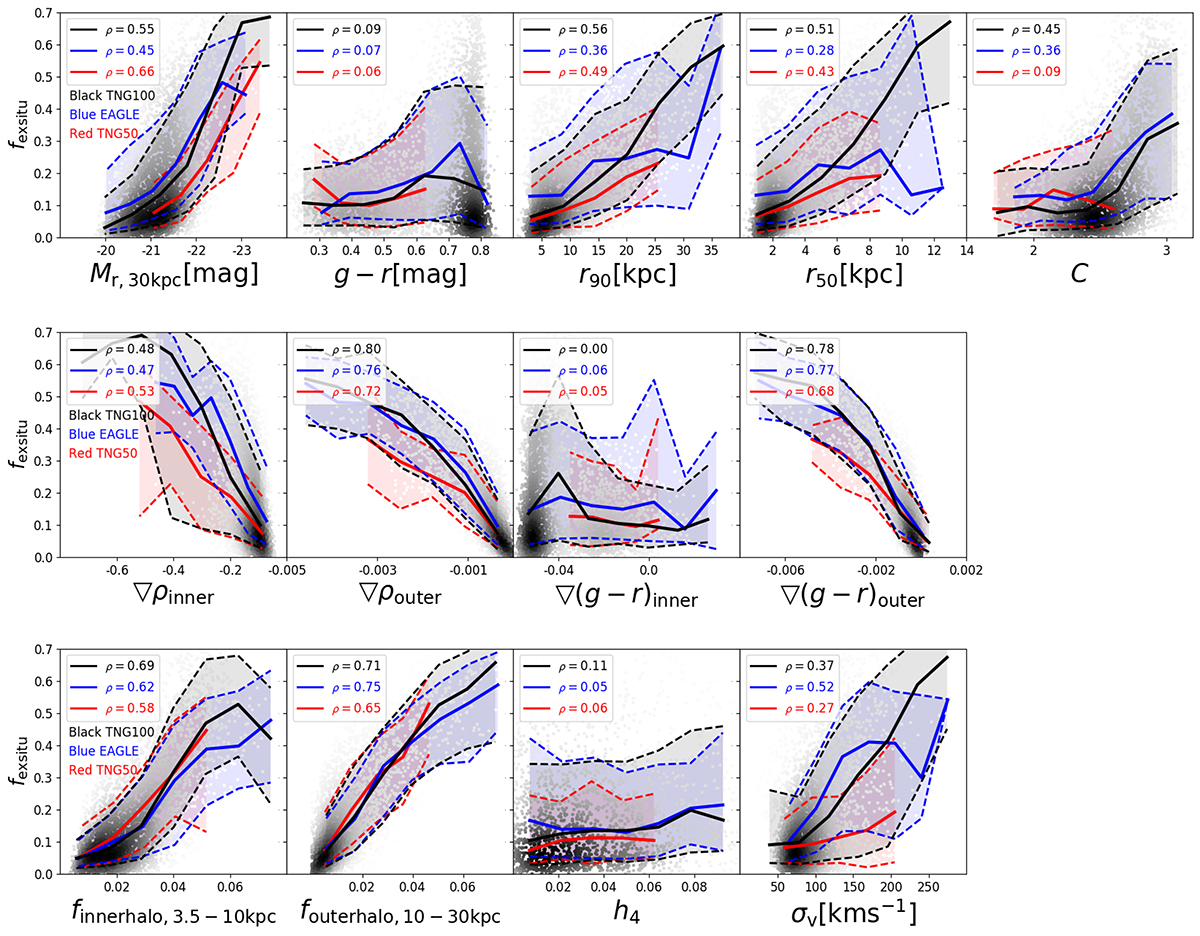
Fig. B.1.
Download original image
Correlation of ex situ stellar mass fraction fexsitu with morphological parameters. The figure is similar to Figure 3, but with the morphological parameters derived from the clean images without observational noise. The black, blue, and red solid curves are running median for TNG100, EAGLE, and TNG50 galaxies; the dashed curves represent the ±σ scatter.
Current usage metrics show cumulative count of Article Views (full-text article views including HTML views, PDF and ePub downloads, according to the available data) and Abstracts Views on Vision4Press platform.
Data correspond to usage on the plateform after 2015. The current usage metrics is available 48-96 hours after online publication and is updated daily on week days.
Initial download of the metrics may take a while.