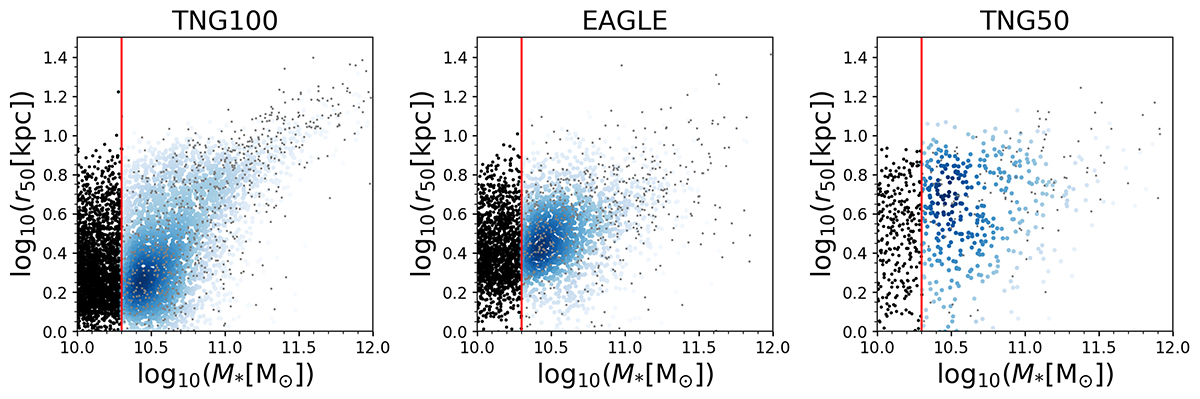
Fig. 1.
Download original image
Galaxy stellar mass–size relation of simulations analysed in this paper: (from left to right) TNG100, EAGLE, and TNG50. We chose the stellar mass, M*, defined within a spherical radius of 30 kpc vs. r50 defined from a 2D image. The galaxies kept in our analysis with M* > 1010.3 M⊙ are coloured in blue, the galaxies with ongoing mergers are removed from our analysis and are coloured in grey.
Current usage metrics show cumulative count of Article Views (full-text article views including HTML views, PDF and ePub downloads, according to the available data) and Abstracts Views on Vision4Press platform.
Data correspond to usage on the plateform after 2015. The current usage metrics is available 48-96 hours after online publication and is updated daily on week days.
Initial download of the metrics may take a while.