Fig. 6.
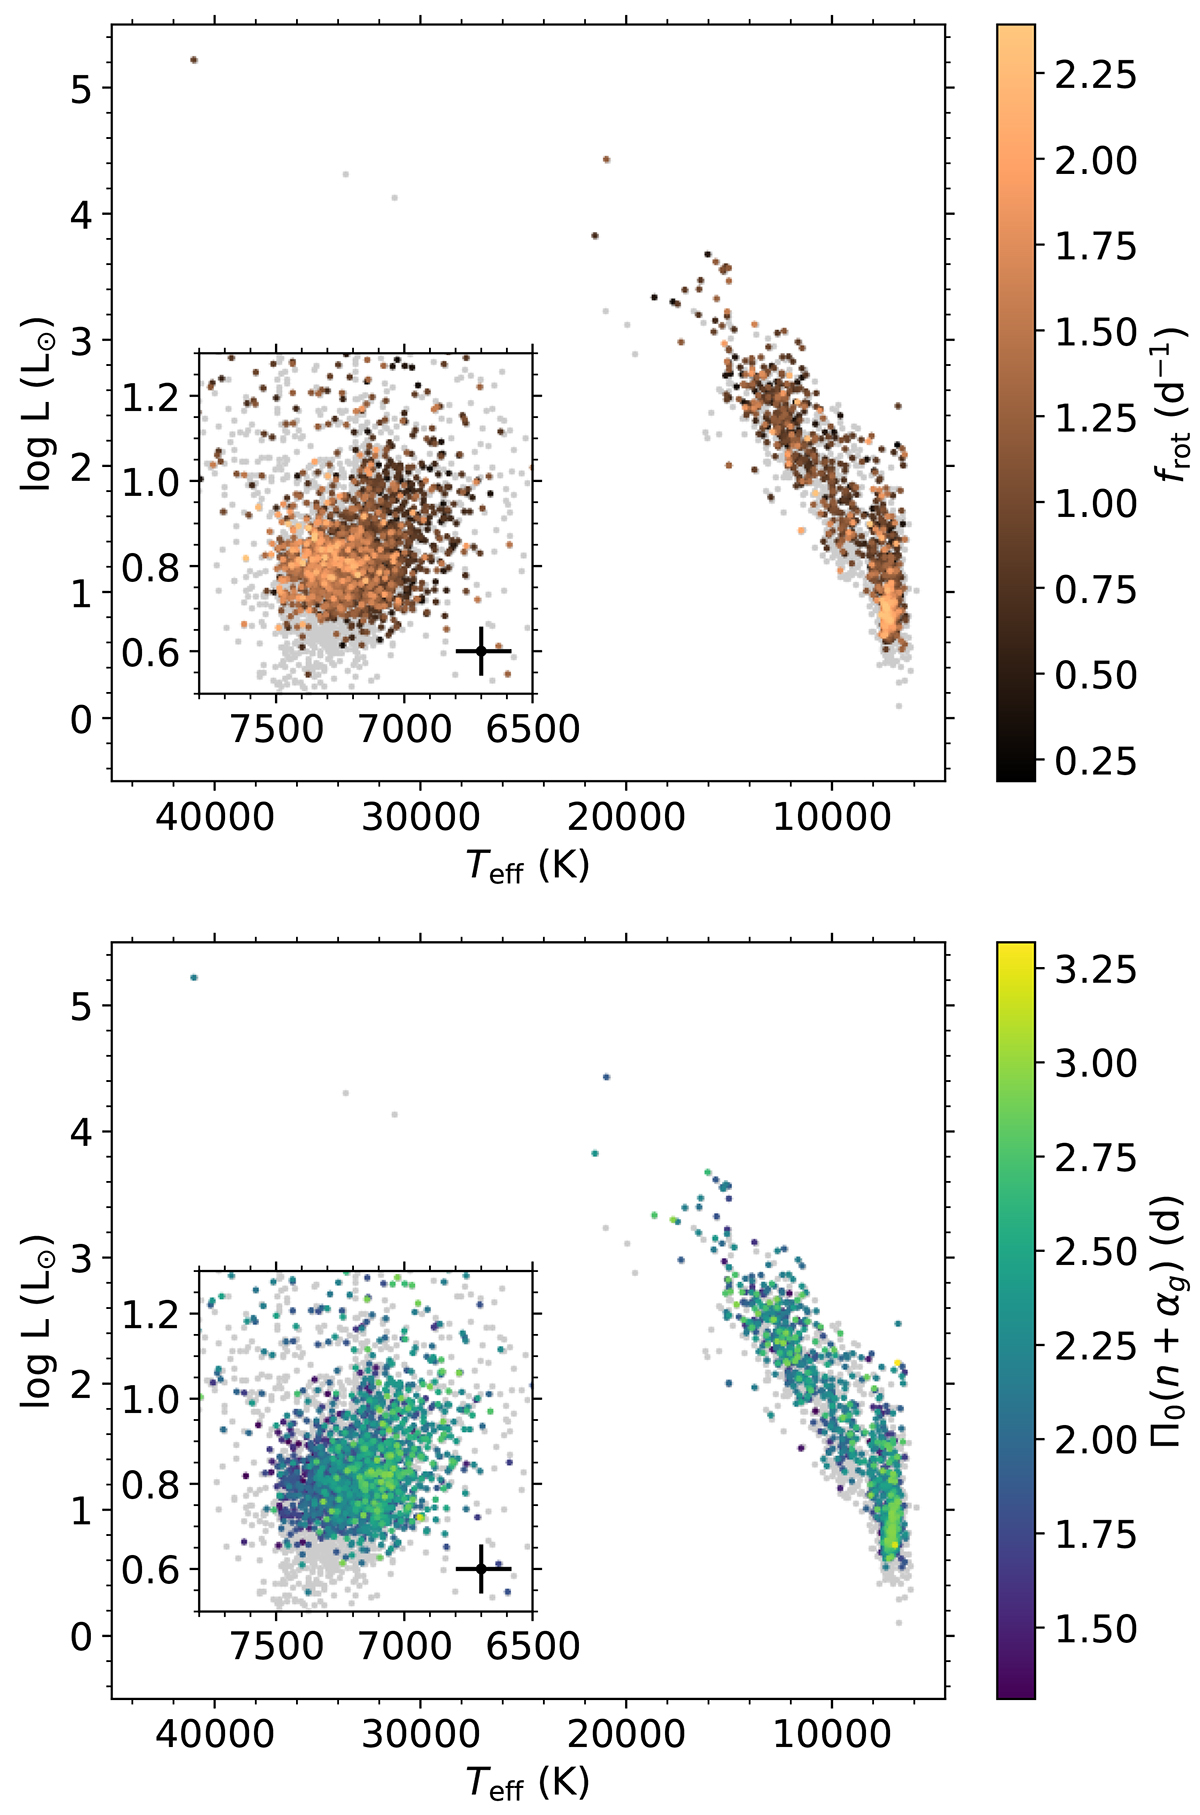
Download original image
Our sample of 2497 Gaia DR3 gravity-mode pulsators in the HR diagram. The markers are coloured according to their frot (top) and Π0(n + αg) values (bottom). Other stars of the sample of 15 692 pulsators from Mombarg et al. (2024a) are shown by the grey markers. The inset axes show close-ups of the γ Dor instability region. Typical 3σ (average) error margins are shown by the black bars in the inset.
Current usage metrics show cumulative count of Article Views (full-text article views including HTML views, PDF and ePub downloads, according to the available data) and Abstracts Views on Vision4Press platform.
Data correspond to usage on the plateform after 2015. The current usage metrics is available 48-96 hours after online publication and is updated daily on week days.
Initial download of the metrics may take a while.