Fig. 3.
Download original image
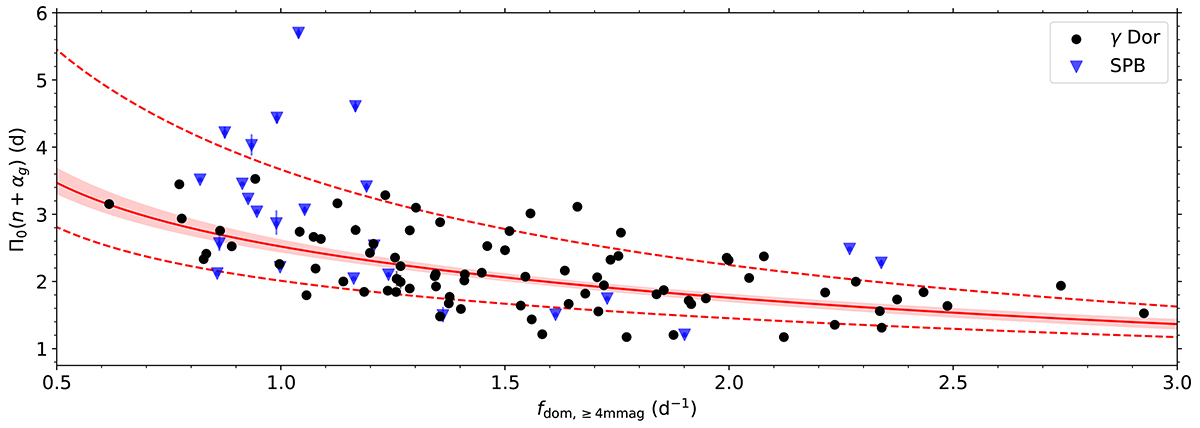
The quantity Π0(n + αg) plotted as a function of the dominant prograde dipole gravity-mode frequency with amplitude above 4 mmag (fdom, ≥ 4 mmag) for 105 γ Dor and SPB stars from Li et al. (2020) and Pedersen et al. (2021). The symbols have the same meaning as in Fig. 1. The relation given by Eq. (3) is shown by the red line, while the shaded area shows the 1-σ uncertainty region. The dashed lines mark the 1-σ confidence region, propagated forward from the confidence regions of the frot values.
Current usage metrics show cumulative count of Article Views (full-text article views including HTML views, PDF and ePub downloads, according to the available data) and Abstracts Views on Vision4Press platform.
Data correspond to usage on the plateform after 2015. The current usage metrics is available 48-96 hours after online publication and is updated daily on week days.
Initial download of the metrics may take a while.