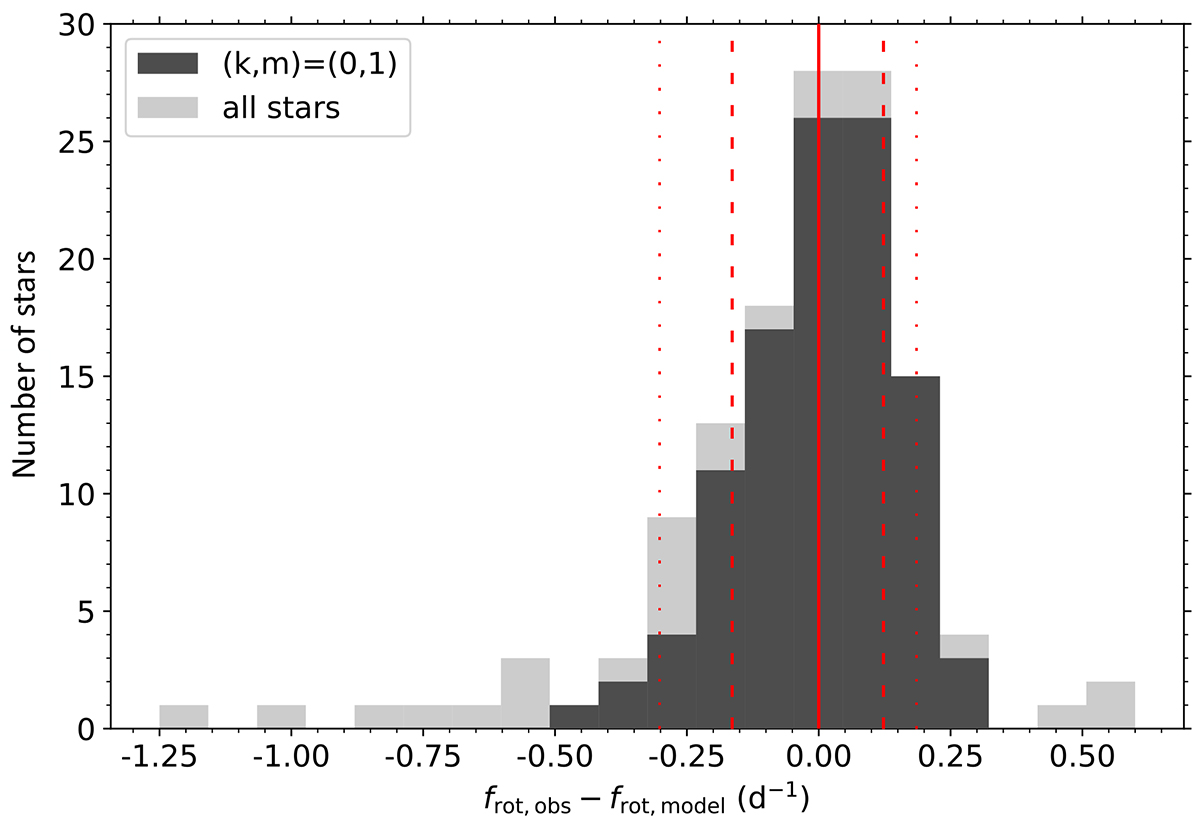
Fig. 2.
Download original image
Residuals from the linear fit described by Eq. (4) for the selected Kepler pulsators used in Fig. 1. The distribution of modes with (k, m) = (0, 1), ν > 1, and observed frequency above 0.35 d−1 is shown in dark grey, wile the distribution of all dominant modes with amplitude ≥4 mmag is shown in light grey. The full, dashed, and dotted lines indicate the same relation and confidence intervals as those in Fig. 1.
Current usage metrics show cumulative count of Article Views (full-text article views including HTML views, PDF and ePub downloads, according to the available data) and Abstracts Views on Vision4Press platform.
Data correspond to usage on the plateform after 2015. The current usage metrics is available 48-96 hours after online publication and is updated daily on week days.
Initial download of the metrics may take a while.