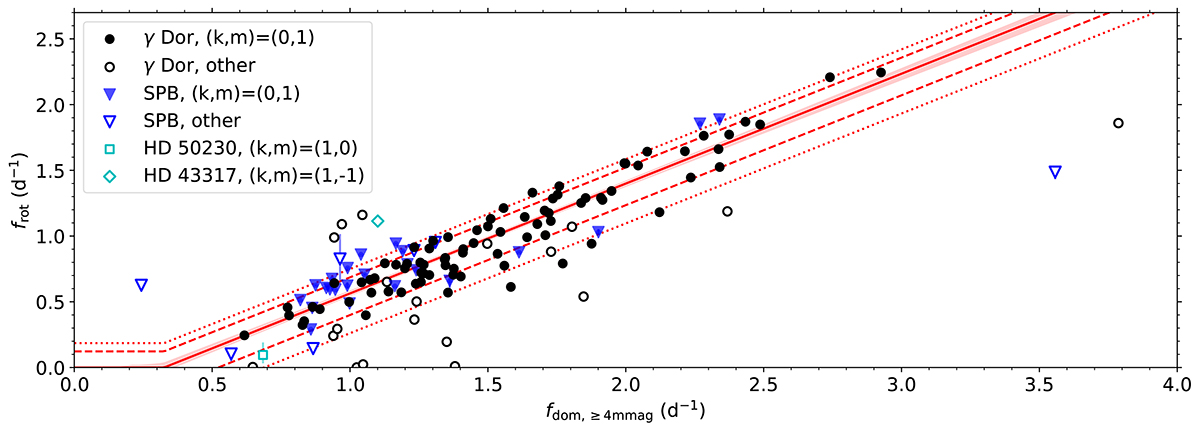
Fig. 1.
Download original image
Near-core rotation frequency frot plotted as a function of dominant mode frequency for Kepler gravity-mode pulsators having an observed amplitude above 4 mmag (fdom, ≥ 4 mmag) from the samples of Li et al. (2020) and Pedersen et al. (2021). Stars are drawn as γ Dor pulsator if they have Teff < 8500 K and Π0 < 0.7 d and as SPB star otherwise. When invisible, the error bars are smaller than the symbol sizes. The linear relation (red line) given by Eq. (4) was computed for the 105 stars having a dominant (k, m) = (0, 1) mode with observed frequency above 0.35 d−1 and with ν > 1 (full symbols). The shaded area shows the 1-σ uncertainty region for this relation. The two pulsators indicated in cyan come from short CoRoT light curves (Degroote et al. 2010; Pápics et al. 2012). As the other open symbols, they were not used in the regression. The dashed (dotted) lines mark the 1-σ confidence interval for frot derived from the residuals with respect to the red line, excluding (including) stars with modes having (k, m)≠(0, 1) or ν < 1.
Current usage metrics show cumulative count of Article Views (full-text article views including HTML views, PDF and ePub downloads, according to the available data) and Abstracts Views on Vision4Press platform.
Data correspond to usage on the plateform after 2015. The current usage metrics is available 48-96 hours after online publication and is updated daily on week days.
Initial download of the metrics may take a while.