Fig. 9.
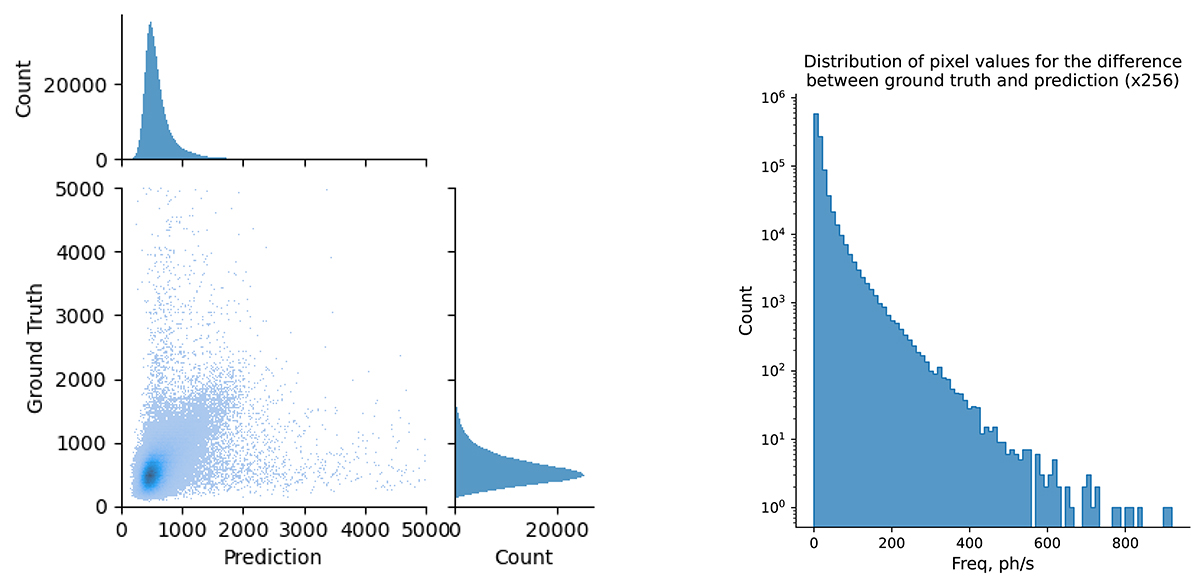
Download original image
Comparison of the differences in pixel value distributions between the ground truth and the predictions. Panel a: Pixel-to-pixel comparison between the predicted values and ground values of the solar images in a curated dataset. This dataset consisted of 100 randomly selected samples from the evaluation dataset. The figure shows a large difference between the predicted values and the real values, which arises because the model underestimates the intensity of the flaring region, and a mismatch in the flaring region also results in a large difference as the nonflaring region is quiet. Panel b: Distribution of the pixel values for the difference tensor between the ground truth and the prediction for the x256 model. The number of higher pixel values decreases rapidly and is nearly 102 per 20 for values between 0 and 40.
Current usage metrics show cumulative count of Article Views (full-text article views including HTML views, PDF and ePub downloads, according to the available data) and Abstracts Views on Vision4Press platform.
Data correspond to usage on the plateform after 2015. The current usage metrics is available 48-96 hours after online publication and is updated daily on week days.
Initial download of the metrics may take a while.