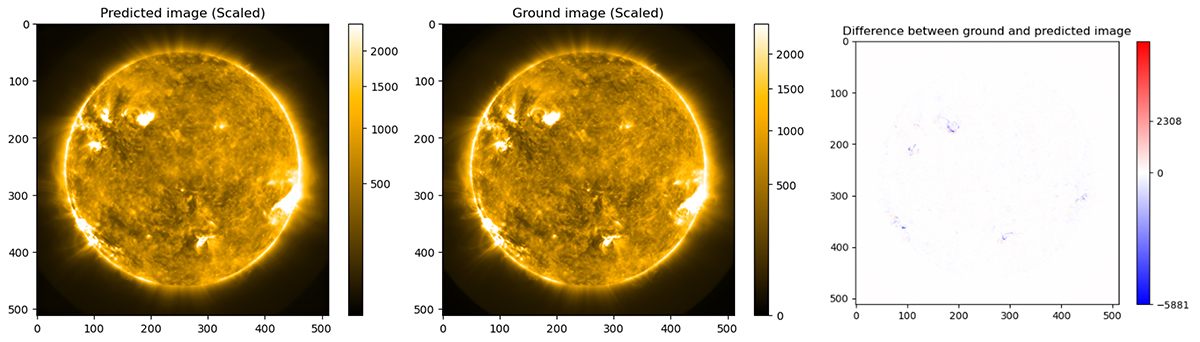
Fig. 8.
Download original image
Randomly selected pair of ground (left) and predicted (middle) images in the 171 Å channel. The images were clipped to the [0, 99] percentile range and their square roots were taken to enhance the contrast to illustrate the pattern better. The difference between the actual pixel values of the two images is displayed on the right, and the minimum and maximum values are indicated in the color bar.
Current usage metrics show cumulative count of Article Views (full-text article views including HTML views, PDF and ePub downloads, according to the available data) and Abstracts Views on Vision4Press platform.
Data correspond to usage on the plateform after 2015. The current usage metrics is available 48-96 hours after online publication and is updated daily on week days.
Initial download of the metrics may take a while.