Fig. 7.
Download original image
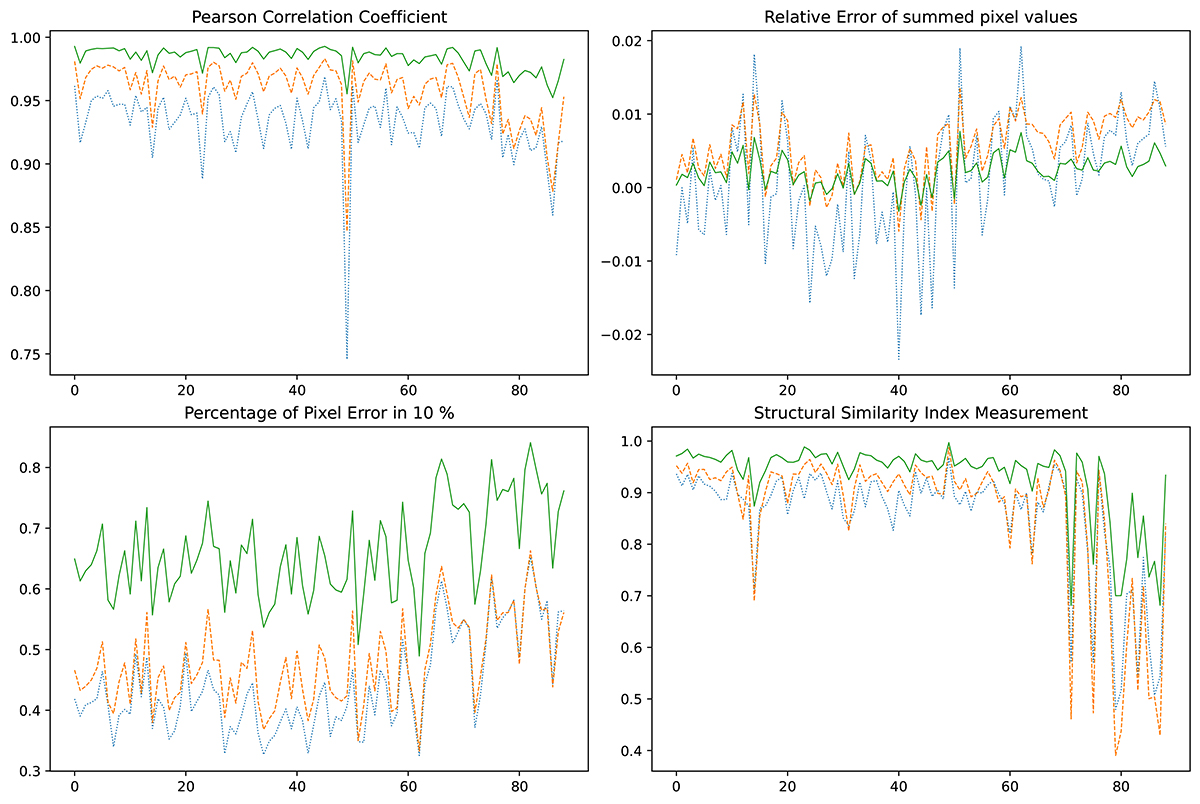
PCC and RE of summed pixel values, PPE10, and SSIM for spatial super-resolution models on the dataset consisting of 98 test images from every year from the chosen cycle. The dotted blue line corresponds to the x64 model, the dashed orange line shows the 128x model, and the solid green line shows the metrics values for the 256x model. All the statistics depend on the resolution and become better as it increases, which correlates with previous inferences.
Current usage metrics show cumulative count of Article Views (full-text article views including HTML views, PDF and ePub downloads, according to the available data) and Abstracts Views on Vision4Press platform.
Data correspond to usage on the plateform after 2015. The current usage metrics is available 48-96 hours after online publication and is updated daily on week days.
Initial download of the metrics may take a while.