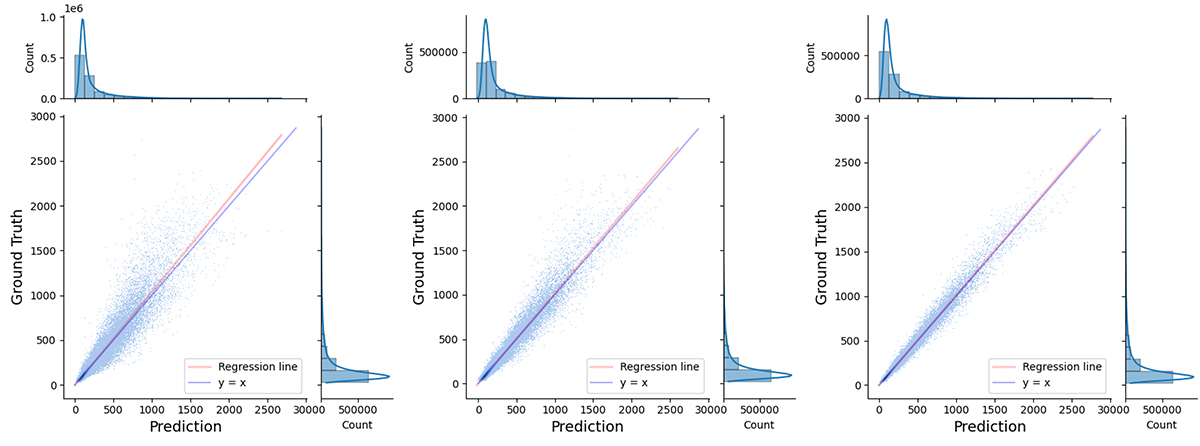
Fig. 6.
Download original image
Pixel-to-pixel comparison for three different models. Left panel: Results for the 642 case. Middle panel: Results for 1282 case. Right panel: Results for the 2562 case. The variance shrinks with increasing input resolution. The corresponding Pearson statistics are 0.9879, 0.9936 and 0.9961. The axes of the main plots show pixel values. The margin plots indicate the 1D distributions along the corresponding axes.
Current usage metrics show cumulative count of Article Views (full-text article views including HTML views, PDF and ePub downloads, according to the available data) and Abstracts Views on Vision4Press platform.
Data correspond to usage on the plateform after 2015. The current usage metrics is available 48-96 hours after online publication and is updated daily on week days.
Initial download of the metrics may take a while.