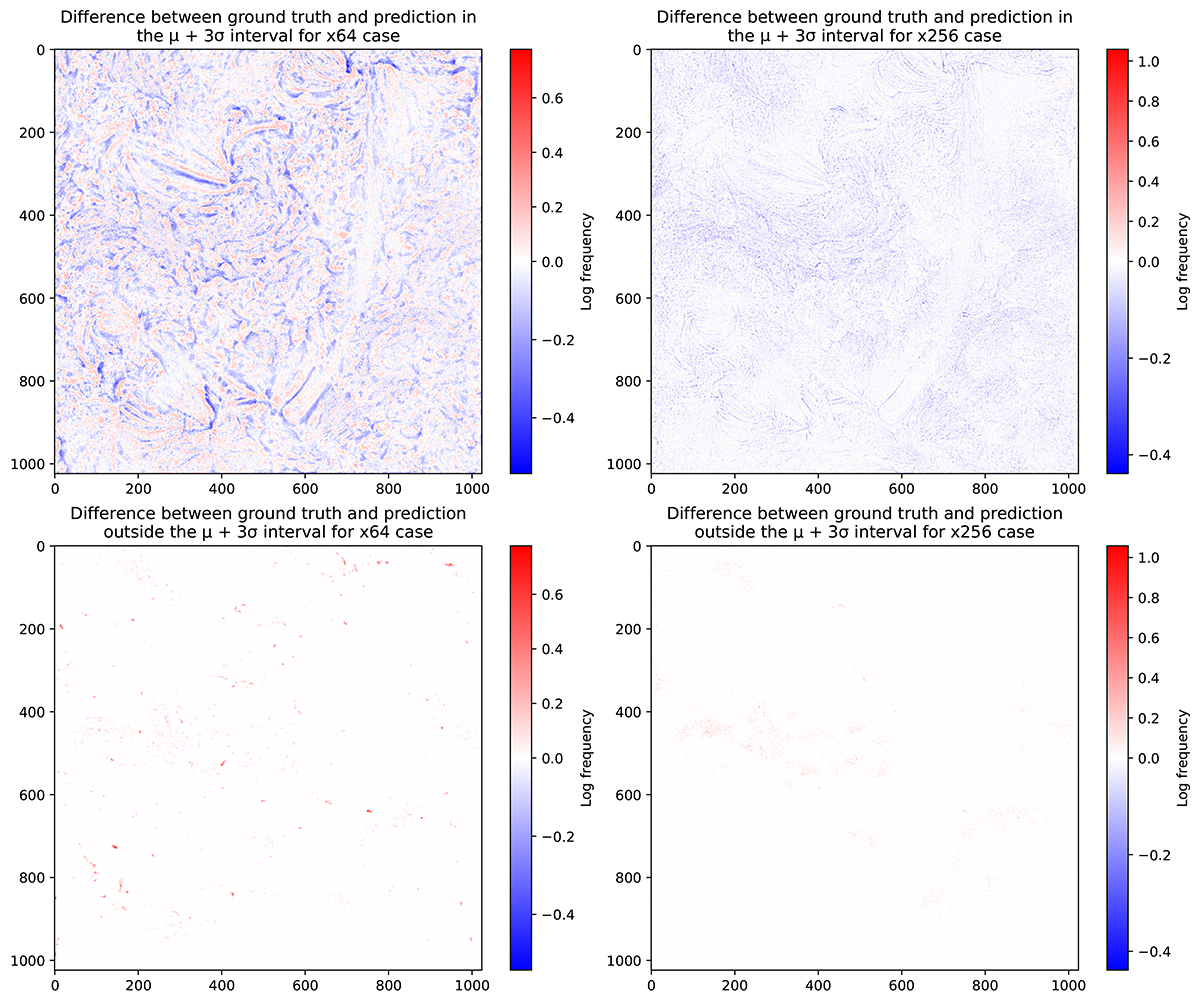
Fig. 5.
Download original image
Pair of columns depicting various data representations. The top left panel shows the disparity between the ground truth and the prediction within the mean plus three standard deviation intervals for the pixel values of the model with the resolution of 64 → 1024. The lower section displays a difference map with all pixel values. The right column exhibits analogous relations, but for the model employing a higher-resolution input.
Current usage metrics show cumulative count of Article Views (full-text article views including HTML views, PDF and ePub downloads, according to the available data) and Abstracts Views on Vision4Press platform.
Data correspond to usage on the plateform after 2015. The current usage metrics is available 48-96 hours after online publication and is updated daily on week days.
Initial download of the metrics may take a while.