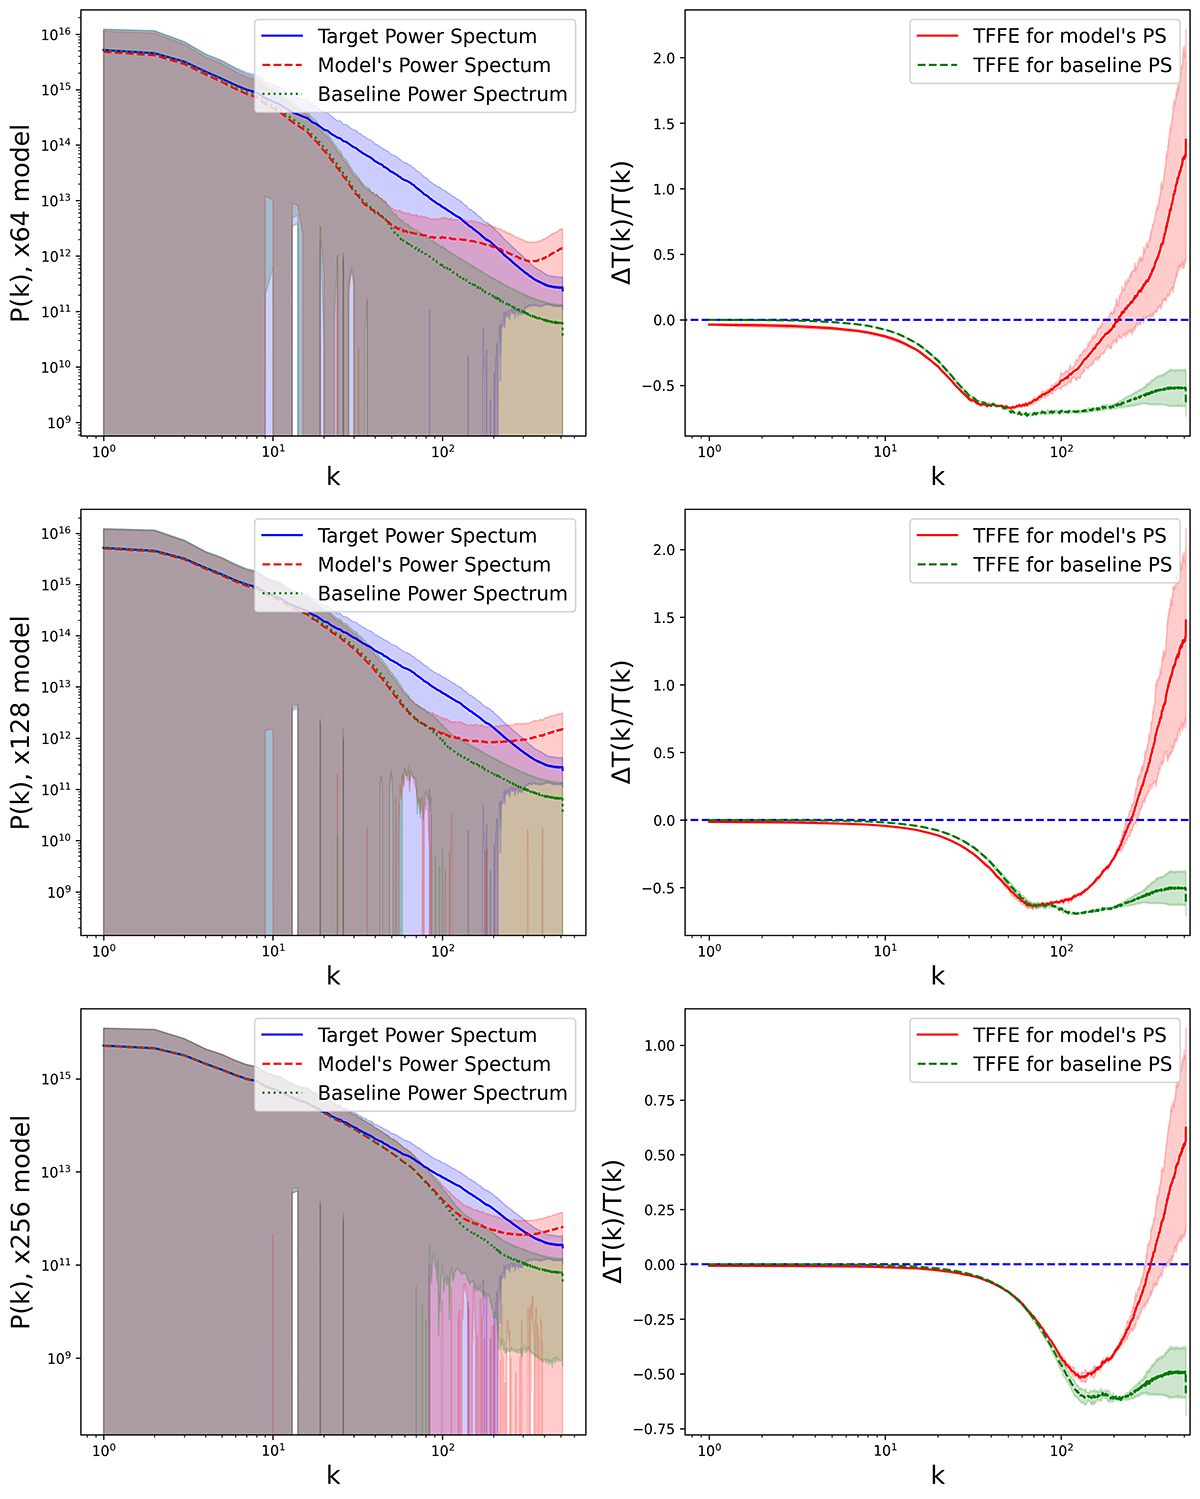
Fig. 3.
Download original image
Power spectra and transfer function fractional errors (TFFE) for all three models. The solid, dotted, and dashed lines in the left column represent average power spectra for the whole test set (target, input, and prediction, respectively). The shading around the lines shows the sigma ranges. In the right column, the solid line represents the average TFFE for the prediction and the target, and the dashed line represents the same for the baseline and the target. This time, the shading represents the functional errors through partial derivatives.
Current usage metrics show cumulative count of Article Views (full-text article views including HTML views, PDF and ePub downloads, according to the available data) and Abstracts Views on Vision4Press platform.
Data correspond to usage on the plateform after 2015. The current usage metrics is available 48-96 hours after online publication and is updated daily on week days.
Initial download of the metrics may take a while.