| Issue |
A&A
Volume 695, March 2025
|
|
|---|---|---|
| Article Number | A207 | |
| Number of page(s) | 10 | |
| Section | Extragalactic astronomy | |
| DOI | https://doi.org/10.1051/0004-6361/202452494 | |
| Published online | 19 March 2025 | |
Baryonic Ecosystem IN Galaxies (BEINGMgII)
II. Unveiling the nature of galaxies harbouring cool gas reservoirs
1
Indian Institute of Astrophysics (IIA), Koramangala, Bangalore 560034, India
2
Pondicherry University, R.V. Nagar, Kalapet, Puducherry 605014, India
3
Universitá degli Studi di Milano-Bicocca, Dip. di Fisica G. Occhialini, Piazza della Scienza 3, 20126 Milano, Italy
4
INAF – Osservatorio Astronomico di Trieste, Via G.B. Tiepolo 11, I-34143 Trieste, Italy
5
INAF – Osservatorio Astronomico di Brera, Via Brera 28, 21021 Milano, Italy
6
European Southern Observatory, Karl-Schwarzschildstrasse 2, D-85748 Garching bei Munchen, Germany
7
Aix Marseille Université, CNRS, LAM (Laboratoire d’Astrophysique de Marseille) UMR 7326, F-13388 Marseille, France
8
Kavli Institute for Astronomy and Astrophysics, Peking University, Beijing 100871, PR China
9
Department of Astronomy, School of Physics, Peking University, Beijing 100871, PR China
⋆ Corresponding author; rvjoshirv@gmail.com
Received:
4
October
2024
Accepted:
14
January
2025
We search for the galaxies associated with the intervening Mg II absorbers over a redshift range of 0.4 ≤ z ≤ 1 using imaging data from DESI Legacy Imaging Surveys and measure the redshift based on the direct detection of nebular emission in the background quasar spectra from the SDSS survey. We find 270 Mg II absorbers associated with strong O [II] or O [III] and Hβ nebular emissions, at a 2.5σ level. Among them, for 213 Mg II absorbers, we detect an absorber host galaxy at impact parameters of 4 ≤ ρ ≤ 16 kpc, including three absorbers associated with a galaxy pair, with a best-fit galaxy spectral energy distribution model based on multi-passband photometric data from DESI Legacy Imaging surveys, supplemented with the infrared VISTA and unWISE imaging surveys. The detection rate of the Mg II absorber host with strong O [II] nebular emission in the finite SDSS fibre of a 2–3 arcsec diameter increases from 0.2% to ∼3% with an increasing equivalent width from 0.3 Å to ∼3.5 Å, which remains near-constant across the probed redshift range. The associated Mg II host galaxies exhibit a wide range of stellar mass from 7.94 ≤ log(M⋆/M⊙)≤11.11, with an average star formation rate (SFR) of 5.81 M⊙ yr−1. The Mg II absorber hosts selected based on O [II] nebular emission mostly exhibit active star-forming systems including 13.4% starburst systems, but 10.2% with a suppressed SFR. The near-constant absorption strength at low-impact parameters suggests a high gas covering fraction. We find that the Mg II equivalent width (W2796) positively correlates with the SFR and specific SFR, likely indicating their wind origin. The average velocity offset between the host and the absorber suggests that the Mg II gas is bound within the dark matter halo.
Key words: galaxies: evolution / galaxies: general / galaxies: halos / galaxies: high-redshift / quasars: absorption lines / galaxies: star formation
© The Authors 2025
 Open Access article, published by EDP Sciences, under the terms of the Creative Commons Attribution License (https://creativecommons.org/licenses/by/4.0), which permits unrestricted use, distribution, and reproduction in any medium, provided the original work is properly cited.
This article is published in open access under the Subscribe to Open model. Subscribe to A&A to support open access publication.
1. Introduction
The interplay between the galactic outflows and gas accretion from the diffuse gas reservoirs surrounding galaxies, i.e., circumgalactic medium (CGM), provides a key insight into the chemical enrichment history of galaxies (Péroux et al. 2020). The quasar absorption line study has been proven to be a powerful tool for tracing the low-density gas in the CGM. In particular, the Mg IIλλ2796,2803 absorption line is a widely used tracer of cool (T ∼ 104K) metal-enriched gas flows in and around galaxies (Tumlinson et al. 2017). Deep imaging and spectroscopic follow-up studies have revealed that strong Mg II absorbers (W2796 ≥ 1 Å) are often associated with active phases of galactic evolution, such as star formation, starburst, or active galactic nucleus activity, and originate in galactic discs on scales of about 10 kpc and in star-formation-driven outflows on scales of ≳100 kpc (Zibetti et al. 2007; Bouché et al. 2012; Kacprzak et al. 2014; Dutta et al. 2020; Lundgren et al. 2021). The observed dependence of Mg II absorption on the azimuthal angle, with a strong absorption above and along the disc plane, supports bipolar outflows along the minor axis and inflows along the major axis (Bouché et al. 2007; Nestor et al. 2011; Lan & Mo 2018; Zabl et al. 2021; Guo et al. 2023; Bacon et al. 2023), which is further supported by the simulations (Péroux et al. 2020; Nelson et al. 2020). The majority of absorption seems to have co-directional and co-planar accretion kinematics (Kacprzak et al. 2011; Lopez et al. 2020; Nateghi et al. 2024). Lan & Mo (2018) have shown that metal absorption is 5–10 times stronger around emission line galaxies on smaller scales than their red counterparts. However, the origin of Mg II absorption and the true nature of absorber host galaxies remain contentious.
Numerous efforts to understand the nature of absorber host galaxies have resulted in a few hundred galaxy-absorber pairs. These galaxies are generally found to be luminous (sub-L* type) at large impact parameters ranging from 10–200 kpc (Chen et al. 2010; Zabl et al. 2019; Dutta et al. 2020). Recent studies based on advanced integral field spectrographs show that the majority of Mg II absorbers are commonly associated with multiple galaxies, which indicates that besides gas accretion and/or outflows the Mg II absorbers likely trace the multiple halos of a galaxy group (Kacprzak et al. 2010; Bielby et al. 2017; Péroux et al. 2017, 2019; Dutta et al. 2020) and/or intragroup medium (Gauthier 2013).
Finding the potential faint counterpart responsible for the absorption at small impact parameters has largely remained challenging, both due to the glare of a bright background quasar and the faint nature of the galaxy at high redshift (Noterdaeme et al. 2010; Joshi et al. 2017b). A number of efforts, using high-spatial-resolution imaging in conjunction with multi-object spectroscopy, have bolstered confidence in the presence of a faint but high star formation surface density absorber host at small impact parameters (Bouché et al. 2007, 2012; Lundgren et al. 2012, 2021, see also, Straka et al. 2015; Joshi et al. 2017b; Guha et al. 2022, 2024). In our recent effort to probe the ultra-strong Mg II absorber in a deep imaging Hyper Supreme-Cam Subaru Strategic Program (HSC-SSP) Survey, we found a high detection rate of ∼40 percent at an impact parameter of ≤30 kpc (Joshi et al. 2024, A&A accepted, hereinafter Paper I). The study of the physical origins of gas in the CGM in the TNG50 cosmological hydrodynamical simulation shows a probability of more than 50 percent for an absorber at small impact parameters of ≲20 kpc being associated with a central galaxy of mass log M⋆ ∼ 8 M⊙ within a typical Δv range of ∼70 to 250 km s−1 (Weng et al. 2024). However, the association of gas with absorbers in simulations over the velocity space can select for gas several times beyond the virial radius (Rahmati et al. 2015; Ho et al. 2021).
In Paper I, we focus on the galaxies hosting ultra-strong (W2796 ≥ 3 Å) Mg II absorbers, primarily identified based on multi-band deep optical (g, r, i, z, y) HSC-SSP Subaru survey and near-infrared (J, H, K) VISTA survey spectral energy distribution (SED) model fitting, whereby 36% of systems were spectroscopically identified from the SDSS spectroscopic survey (see below). We show that the galaxies hosting USMgII absorbers found to exhibit a broad stellar mass distribution ranging from 8.65 ≤ logM⋆[M⊙] ≤ 11.67 are typically star-forming main sequence galaxies, with 20% having a starburst nature. These absorbers are preferentially aligned along the galaxy’s minor axis with the azimuthal angle; that is, ϕ ≥ 50°, likely tracing large-scale outflows, or along the major axis with ϕ ≤ 30°, originating in an extended galactic disc. The quasar sightline hosting USMgII systems shows a factor-of-three-higher galaxy overdensity of 0.00031 galaxies per kpc2, especially at an impact parameter of ≤50 kpc. To gain insights into the nature of absorber host galaxies and the potential origins of Mg II absorbers, in this paper we extend the study from Paper I down to the W2796 of ∼0.3 Å. Here, we leverage the large sky coverage of ≈14 000 square degrees from the Dark Energy Spectroscopic Instrument (DESI) Legacy Surveys (DECaLS1) to identify potential absorber host galaxies. Unlike Paper I, in which we used the multi-band SED fits for galaxy identification, here, with the limited DECaLS passbands for obtaining reliable photometric redshifts, we focus exclusively on galaxies with robust spectroscopic redshift estimates derived from nebular emission lines observed in quasar spectra from the SDSS spectroscopic survey.
This paper is structured as follows. Section 2 describes our sample selection. This is followed by the methodology and analysis in Section 3. Section 4 examines the absorber galaxy association and the nature of galaxies associated with Mg II absorbers. The discussion and conclusions of this study are summarized in Section 5. Throughout, we have assumed a flat Universe with H0 = 70 km s−1 Mpc−1, Ωm = 0.3, and ΩΛ = 0.7.
2. Data and sample selection
Utilizing the Mg II absorber catalogue from SDSS-DR16 Anand et al. (2022) and SDSS-DR7/DR12 Zhu & Ménard (2013), we assembled 119,144 unique quasar sightlines tracing 155,654 unique absorbers, considering pairs of absorbers within 500 km s−1 as identical systems. Following Paper I, we have extended our search to all the W2796 ranges by exploiting the imaging data from the DECaLS, spanning a wide sky coverage of ≈14 000 sq. degrees (Dey et al. 2019). The DECaLS offers multi-band imaging data in three optical passbands (g, r, z) at a 5σ survey depth of g = 24.0, r = 23.4, and z = 22.5 AB magnitudes with a resolution of ≈0.262″ per pixel. The DESI footprint covers a total of 118,306 quasar sightlines hosting 154 596 intervening absorbers within a broad redshift range up to z ≲ 2.7. Considering the limitations in obtaining precise photometric redshifts with the limited passbands in the DECaLS survey, in this study we solely focus on spectroscopically identified galaxies. Therefore, to associate the absorber with galaxies, we restricted our search to sightlines with at least one photometric counterpart detected within 2 arcsecs around the quasar (see Section 3.2). That is primarily to take advantage of the finite fibre diameter of 3″(2″) used in SDSS(BOSS), which integrates the light from all the objects falling in the fibre (Noterdaeme et al. 2010; Joshi et al. 2017b) and enables to directly detect the nebular emission (e.g. O [II], Hβ, O[III]) from absorber host galaxies in the quasar spectra. Given the median seeing of 1.3″ for DESI surveys, over the search radius of 2″ centred on the quasar, a significant part of the galaxy may fall inside the fibre. This led to a sample of 11 037 absorbers along 8565 quasar sightlines with a total of 8792 galaxies detected within the defined search radius. Further, to avoid the false positive detection of O [II] nebular emissions due to poor sky removal, we avoided the wavelength region above 7500 Å where the [O II] λλ3727,3729 emission line falls in the sky region. This wavelength translates to a redshift of z ≤ 1 for searching the O [II] emission. This resulted in the final sample of 5487 absorbers along 4812 sightlines with 5508 galaxies detected within the defined search radius.
3. Analysis
3.1. Searching for the nebular emissions
We searched for the [O II] λλ3727,3729 emission line for each Mg II absorber within the velocity range of ±400 km s−1 around the absorber redshift (zabs) in the quasar continuum-subtracted spectrum. The detection significance of the emission line feature was determined based on the signal-to-noise ratio defined in Bolton et al. (2004) as  , where fi is the residual line flux in the ith pixel, σi is the flux error, and ui is a Gaussian kernel, normalized such that ∑iui = 1. The position and line width of the kernel were determined by minimizing the χ2 over the defined velocity window.
In addition to the O [II] emission line, we also searched for the Hβ, and [O III] λλ4959,5007 nebular emissions. Given that all our quasar sightlines host at least one close companion, we considered any feature detected at ≥2.5σ as a positive O [II] detection, resulting in 259 absorbers that include 165 systems with an O [II] detection at a ≥3σ level. Alongside, we also considered 11 systems with the [O III] λλ4959,5007 and/or Hβ nebular emission detected at ≥3σ level. In addition, we performed visual scrutiny for any bad pixel, continuum, or strong skyline regions to avoid the false positive, resulting in a total of 270 Mg II absorbers with associated nebular emissions. Of these, 242 are new detections and 28 absorbers are part of the galaxy on top of the quasar sample from Joshi et al. (2017a).
3.2. Origin of nebular emission: Absorber-galaxy association
For the absorber-galaxy association of the candidate absorber host galaxy detected at the low O [II] SNR of 2.5σ, following Paper I, we further performed the multi-band SED fitting. The DECaLS optical passband g, r, i, z fluxes were supplemented with the forced photometry of optically detected sources in the mid-infrared passbands W1 and W2 from unblurred Wide-field Infrared Survey Explorer (unWISE) co-added images reaching up to a 5σ depth of 20.0 and 19.3 AB magnitudes in W1 and W2, respectively (Dey et al. 2019). The DECaLS fluxes were obtained by modelling each source, detected in three individual-band image stacks at the 6σ level, using the Tractor algorithm, which works on pixel-level data. In brief, the Tractor models each source using a small set of parametric light profiles, including a delta function for point sources, a de Vaucouleurs law, an exponential disc, or a composite de Vaucouleurs plus an exponential. The best-fit model is determined by convolving each model with the specific PSF for each exposure, fitting to each image, and minimizing the residuals for all images. It is assumed that the model is the same across all the bands; for example, if the source is spatially extended, then the same light profile (an exponential disc, de Vaucouleurs, or combination) is consistently fit to all images to determine the best-fit source position, source shape parameters, and photometry (Dey et al. 2019). To extract the mid-infrared photometry of W1 and W2 WISE bands, which have a resolution of 6 arcsecs, forced photometry is performed by modelling each optically detected source forcing the location and shape of the model by convolving with the WISE PSF and fitting to the WISE stacked image (see also, Lang et al. 2016).
In addition, we also searched for near-infrared J, H, Ks passband images from the VISTA Surveys2. We obtained a 39 source in the VHS (at a 5σ depth of J = 21.2, H = 20.6, Ks = 20.0) survey and 7 in the VIKING (at a 5σ depth of J = 22.1) survey. For the near-IR flux measurement, we simultaneously modelled the quasar and the galaxy at the centroid obtained from DESI images. In the case of non-detection, we have estimated the flux upper limits at a 3σ level. To obtain more secure results, we demanded that the target be detected (at 3σ level) in any of the three filters mentioned above, resulting in 251 sources, of which more than ∼75% of the systems have a minimum four-band detection.
Next, we modelled the galaxy SED at a fixed absorber redshift using BAGPIPES3 (Carnall et al. 2018) and the MultiNest sampling algorithm (Feroz et al. 2009). We used a simple model considering a delayed star formation history with a wide parameter space for the age, between 50 Myr to 13.5 Gyr, mass formed (6 ≤ log(M*/M⊙)≤13), and metallicity (0.005 < [Z/H]< 5). We assumed the dust extinction law of Calzetti et al. (1994) with a total extinction of 0 < Av < 4.
For the 270 Mg II absorbers with an O [II] detection ≥2.5σ level or other emission lines (i.e, Hβ, O [III]), we found 273 sources within the search radius of 2″. Out of these sources, we obtained 216 bona fide sources with a good SED fit (see Figure 1). However, for the remaining 57 sources with a robust O [II] detection, but a poor SED fit, we analysed DECaLS residual images to detect any other possible galaxy counterpart. We note that the poor SED fit may either be due to limited filters or the fact that absorption is produced by some other undetected faint nearby galaxy or issues related to the quasar continuum subtraction. Interestingly, we detect a non-zero flux residual at a > 3σ level for nine sources. Figure 2 shows an example of an absorber galaxy candidate within 2 arcsecs around a quasar with strong [O II] λλ3727,3729 and [O III] λ5008 nebular emission, but a poor SED fit at the absorber redshift. The residual images reveal an additional stellar counterpart detected at ≥3σ in all the passbands, marked as a cross symbol, which is likely the true absorber host. Hereafter, to study host galaxy properties of Mg II absorbers, we only consider 216 objects with good SED fit. The remaining 57 systems are considered bona fide cases of the galaxy on top of the quasar (the catalogue is available at the CDS). The properties of the large set of Mg II absorber host galaxies without detected nebular emission lines, but with good SED fits, are further explored in Chaudhary et al. (in prep.).
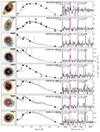 |
Fig. 1. Postage stamp DECaLS colour composite images, centred on the quasar. The SDSS fibre, with a radius of 1.5″, is indicated by dashed circles, while the cyan-coloured aperture highlights the MgII host galaxy. The second column exhibits the multi-band SED fit at the absorber redshift. Columns three and four show the detected [O II] λλ3727,3729 and [O III] λ5008 nebular emission line from the Mg II absorber host, respectively. |
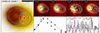 |
Fig. 2. An example highlighting the advantage of using deep-imaging and strong nebular emission line-based search to avoid false positive detections. Left panel: Multi-band colour composite image centred on quasar J152555.82+010835.5. The quasar and absorber host galaxy candidates detected in the DECaLS survey within 2 arcsec are marked as star and cross symbols. In addition, the dashed and solid circle shows the SDSS fibre of radius 1.5 arcsec and absorber candidate. The contour represents the best-fit model for the quasar and the galaxy provided by DECaLS. Right upper panels: Residual g, r, i, z passband images. The cross symbol shows an additional stellar counterpart not detected by DECaLS, but detected in the residual images of all the passbands, which is likely the potential host. Lower panels: SED fit at the absorber redshift of zabs = 0.39 along with the [O II] λλ3727,3729 and [O III] λ5008 nebular emission. |
4. Results
In Figure 1, we show a few examples of Mg II absorber galaxies. The quasar’s proximity – within 2″– enabled us to map the gas in the galaxy halo or ISM over physical scales of ∼4 − 16 kpc over the redshift range of 0.4 < z < 1. Here, we discuss the dependence of the absorber properties on the host galaxies.
4.1. Detection rate of emission selected Mg II absorber galaxies
In the right panel of Figure 3, we show the rest-frame equivalent width (W2796) distribution of our primary sample of z < 1 Mg II absorbers along with the absorbers with the direct detection of O [II] nebular emission. The majority, 91%, of Mg II systems belong to the strong Mg II absorbers with W2796 ≥ 1 Å, with a median W2796 of 2 Å. The detection fraction of Mg II galaxies at proximity to the quasar increases with W2796, rising from ∼0.2 percent for an absorber with W2796 of ∼1 Å to more than 2 percent for W2796 ≥ 3 Å. Furthermore, we compare the detection fraction of emission-selected galaxies as a function of redshift. The left panel of Figure 3 shows the distribution of thedetection fraction typically ranging between 0.006 to 0.003 from redshift 0.4 to 1, with a median of 0.005. We note that the detection fraction mentioned above represents a lower limit, constrained by the finite fibre size, and limited imaging and spectroscopy sensitivity in identifying faint galaxies. The above detection rate is consistent with the spectroscopically selected galaxy on top of quasar cases by Joshi et al. (2017b), which varies between ∼1 − 3 percent for Mg II absorbers with W2796 > 2 Å from SDSS-DR7 and SDSS-DR12, respectively. In contrast to the low detection rates observed in studies, including the present one, that rely on nebular emission line detection in quasar spectra with a finite fibre size, in Paper I, we find a significantly higher detection rate of around 40% for ultra-strong Mg II absorbers. This highlights the importance of deep imaging and spectroscopic surveys for detecting faint absorber hosts and studying their metal-enriched halos.
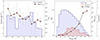 |
Fig. 3. Detection probability of Mg II absorbers. Left panel: Detection fraction as a function of redshift. The average DECaLS rmag of galaxies per redshift bin is shown as a square, along with the 16th and 84th percentiles. Right panel: Equivalent width (W2796) distribution of Mg II absorbers for entire sample with z < 1 (solid histogram). The hatched histogram shows the distribution for the detection set, given in the right-hand-side ordinates. The detection fraction per W2796 bin is shown as a square symbol given in the additional y axis, the right-hand-side ordinates. |
4.2. Star formation rate of Mg II absorber host galaxies
Using our sample of Mg II galaxies with the direct detection of O [II] and O [III] nebular emissions, we derived the star formation rate (SFR) assuming stars as the ionizing source, and using the prescription given by Kennicutt (1998); that is, SFRO [II] = (1.4 ± 0.4)×10−41LO [II]. The O [II] SFR is found in the range of 0.18 to 17.89 M⊙ yr−1. Considering the O [II] luminosity function of galaxies at z = 0.65 from Comparat et al. (2016), our measured O [II] nebular line luminosity ranges between 0.14–3.5 L⋆O [II]. We note that the measured SFRs are lower limits as we did not apply any correction for the dust reddening and the emission line fluxes are affected by fibre losses (López & Chen 2012; Joshi et al. 2017b).
We derived the physical parameters, that is the stellar mass and the SFR, using BAGPIPES multi-band SED modelling. The Mg II galaxies in our sample trace the stellar mass ranging between 7.94 ≤ log(M⋆/M⊙)≤11.11, with an average ⟨log M⋆⟩ of 9.89 M⊙. Out of 216 galaxies, 194 are star-forming systems defined as logsSFR > −10.6 yr−1. These galaxies exhibit a typical SFR of 0.33 ≤ SFR[M⊙ yr−1] ≤ 218.27, with a median ⟨SFR⟩ of 5.81 M⊙ yr−1. A select number – 10.2% – of Mg II galaxies show a passive nature with logsSFR < −10.6 yr−1 and  of 0.15
  . In Figure 4, we compare the stellar mass versus star formation of our Mg II absorber galaxies. For reference, we show the best-fit relation for main sequence star-forming galaxies at ⟨z⟩∼0.7 from Popesso et al. (2023). As our galaxies are selected based on O [II] nebular emission, it is evident that the majority of Mg II absorber hosts are star-forming galaxies, following the star formation main sequence. The same is clear from the top panel of Figure 4 showing the SFR, normalized by the main sequence star formation at the respective stellar mass and redshift, using the same best-fit relation depicted in the bottom panel. About 13.4% of the systems with an SFR that is a factor of three to four higher than the main sequence show a starburst nature (Elbaz et al. 2018), whereas a large fraction have a sufficiently higher SFR to launch strong outflows (Murray et al. 2011) (see Figure 4).
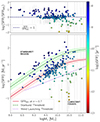 |
Fig. 4. Star formation main sequence relation for MgII absorber host galaxies. The symbols are colour-coded with a specific SFR. The shaded and hatched regions indicate the 1σ confidence interval. Additionally, the dotted line represents the SFR threshold for wind launching from Murray et al. (2011). Top panel: SFR of Mg II galaxies normalized by the main sequence star-forming galaxy at the respective redshift. |
4.3. Dependence of Mg II absorbers on galaxy properties
We explored the various correlations between the absorber properties such as the W2796 strength, the equivalent width ratio between Fe II and Mg II absorption (W2600/W2796) that maps the α enrichment, and the impact parameter (ρ) with the galaxy properties, such as M⋆ and the SFR. Firstly, we tested the firmly established anti-correlation between W2796 and (ρ). The left panel of Figure 5 shows the W2796 as a function of ρ. To examine the dependence of Mg II absorption strength on galactocentric distance, we fitted a log-linear model as log W2796 (Å) = α + β × ρ (kpc), with a likelihood function given in Eq. (7) of Chen et al. (2010), and sampled the posterior probability density function using PyMultiNest. For the Mg II galaxies with lower ρ in our sample, we obtained a best-fit parameter of  . Figure 5 shows the best-fit log-linear model, along with a 1σ uncertainty in the shaded region. The W2796 mildly anti-correlates with ρ, which is consistent with previous studies (Chen et al. 2010; Nielsen et al. 2013). This hints that the absorbing gas possesses a higher covering fraction at small impact parameters of ≤20 kpc (see also, Dutta et al. 2020).
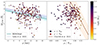 |
Fig. 5. Radial dependence of Mg II absorption strength. Left panel: Mg II absorber rest-frame equivalent width versus impact parameter along with the best fit shown as a hatched region. The W2796-vs-ρ best-fit relation from Guha et al. (2022) is shown as a shaded region. Right panel: Mg II absorber equivalent width versus impact parameter normalized by the galaxy’s virial radius (ρ/Rvir). The best-fit relation from Churchill et al. (2013) is shown as a hatched region. The galaxies with impact pentameters below R90 radii are shown as squares. The symbols are colour-coded with stellar mass. |
Previous studies have revealed an empirical correlation between the W2796 and the galaxy’s stellar mass (Churchill et al. 2013; Dutta et al. 2020). For the ρ range in our study, we find that the W2796 for the massive galaxies (logM⋆ ≥ ⟨logM⋆⟩) are not significantly different compared to the low-mass galaxies based on a Kolmogorov-Smirnov (KS) test statistic of D = 0.05 at pnull = 0.99. We further investigated the influence of stellar mass on the W2796–ρ anti-correlation for the above two subsets using a two-dimensional KS test. The result suggests that the distributions of the W2796–ρ are likely drawn from the same parent population, with D = 0.097 and pnull = 0.83. In an analysis of 183 isolated Mg II absorber galaxies over 0.07 ≤ z ≤ 1.12 within projected galactocentric distances of ρ ∼ 200 kpc, Churchill et al. (2013) found that the scatter in the W2796–ρ plane vanishes when the stellar mass is accounted for. Therefore, we compared the W2796 with ρ/Rvir, where Rvir is virial radius defined as an overdense region with a density that is 200 times the critical cosmic density, ρcrit; that is, Rvir = (Mh/(3/4π)200 ρcrit)1/3. Here, we estimated the virial radius by converting the stellar mass into the halo mass using the stellar-to-halo mass relation from Girelli et al. (2020). The right panel of Figure 5 shows W2796 versus ρ/Rvir along with the best relation from Churchill et al. (2013). We note the large scatter in W2796 distribution may result from the sightlines tracing the galaxy ISM. To test this possibility, using the universal stellar mass-size relation of galaxies from Ichikawa et al. (2012), we measured the 90 percent-light (R90) radii of galaxies and compared the relation between W2796 versus ρ/Rvir for the systems with ρ ≥ R90, likely tracing the gas in the halo and disc-halo interface (see Figure 5, right panel). The evident tighter relation between W2796 and ρ/Rvir implies that the Mg II gas is strongly linked to the halo mass (see also, Churchill et al. 2013).
Considering that our detection probes low-impact parameters of < 20 kpc, it offers to probe the disc halo interface where the impact of galactic outflows is more pronounced. The metal enrichment of the CGM is directly related to the supernova rate. Therefore, the ratio of α elements to Fe should reflect the supernova rates and efficiency of outflows in enriching the CGM. Joshi et al. (2018) have shown that the Mg II absorbers detected in nebular emission in the SDSS fibre spectra of quasar show a strong Fe II absorption with W2600/W2796 > 0.5. We detect a similar trend, with strong emission line galaxies associated with higher W2600/W2796 ratio ranging between 0.5 − 0.8. In Figure 6, we compare the W2600/W2796 as a function of ρ/Rvir. The W2600/W2796 show no correlation with ρ/Rvir with the Kandall’s τ coefficient of τ = −0.09 with Pnull = 0.05. Furthermore, to check the dependence of α enrichment on the stellar mass, we divided our sample into dwarf galaxies with log(M⋆/M⊙)≤9.5 and massive galaxies with log(M⋆/M⊙)≥10. We compared the W2600/W2796 for a subset of 38 dwarf galaxy split at the median ρ/Rvir, shown as a square symbol in Figure 6. The declining trend in the W2600/W2796 ratio with increasing distance is evident and corroborated by Kendall’s correlation coefficient of τ = −0.48 at pnull < 0.01. This is consistent with the observed decreasing radial profile of gas-phase Fe/α ratio in the gaseous halo around massive quiescent and star-forming galaxies (Zahedy et al. 2017).
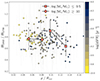 |
Fig. 6. Rest-frame equivalent width ratio between Fe IIλ2600 and Mg IIλ2796 absorption versus impact parameter normalized by the galaxy’s virial radius (ρ/Rvir). The symbols are colour-coded with specific SFRs. |
Interestingly, the subset of massive galaxies with log(M⋆/M⊙)≥10 in our sample show relatively lower W2600/W2796 at smaller ρ/Rvir. The relatively lower ρ/Rvir for the massive galaxies in our sample, preferentially probing the extended disc with higher dust, likely give rise to lower α enrichment due to excess depletion of Fe II on to dust grains. To test this scenario, following Srianand et al. (2008), we measured the selective reddening, E(B − V), by fitting the quasar composite spectrum, reddened by the Small Magellanic Cloud extinction curves (Gordon et al. 2003). The median reddening along Mg II sightlines is found to be E(B − V) = 0.14, which is similar to what is found for high H I column density (N(H I) ≥ 1020.3 cm−1) damped Lyα absorber systems (Murphy & Liske 2004). The higher Fe II depletion for the above subset of massive galaxies is also supported by higher E(B − V) = 0.25 ± 0.05, than E(B − V) = 0.12 ± 0.04 for the dwarf galaxy subset. It is worth noting that the W2600/W2796 ratio has been observed to increase with increasing neutral hydrogen column density Rao et al. (2006, see their Figure 10). Consequently, the observed decline in the W2600/W2796 ratio could also be influenced by the decreasing neutral hydrogen column density with increasing galactocentric distance.
In Figure 7, we show the W2796 dependence on M⋆, SFR, and the specific SFR (sSFR). The median W2796 over three equal bins is also shown as square. The strength of W2796 is mildly correlated with the SFR and sSFR with Kendall’s τ correlation coefficient of τk = 0.16, 0.12 with a null probability of pnull ≲ 0.01, respectively. This likely implies that the positive correlation between W2796 versus sSFR is driven by SFR. The inset in the right panel of Figure 7 shows the galaxies with SFRs that are consistent with the main sequence star-forming galaxies at the respective redshift within the 1σ range. For this subset of main sequence galaxies, the W2796 and sSFR positively correlate with Kendall’s-τ correlation coefficient of τ = 0.13, and Pnull = 0.03.
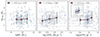 |
Fig. 7. Distribution of Mg II equivalent width with the galaxy stellar mass, SFR, and specific SFR. The square symbols represent the median values over three equal bins. |
4.4. Mg II gas-galaxy kinematics
Here, we test if the Mg II gas is kinematically bound to the halo by using the relative galaxy and absorption velocities and compare it with the escape velocities of their halo. Apart from the outflows, the velocity offset may result from the accreting material from the intergalactic medium or galactic fountains, which is difficult to disentangle. Figure 8 shows escape velocities at an average impact parameter of 10 kpc and a maximum impact parameter of ∼20 kpc, respectively, in our sample, computed for a spherically symmetric Navarro–Frenk–White dark matter halo profile (Navarro et al. 1996), as a function of halo mass. The halo mass was derived based on the respective absorber redshifts and the stellar masses using the stellar-to-halo mass relation given by Girelli et al. (2020). It is evident that the majority of the absorption velocity centroids are below the estimated galaxy halo escape velocities. It is worth noting that measured relative velocity depends on the galaxy inclinations and quasar sight-line azimuthal angles. Therefore, it is likely that some of the systems exceed the estimated galaxy halo escape velocities. The distribution of velocity separations between Mg II absorption and their host galaxies tends to be Gaussian, with a mean offset of 78 km s−1 and dispersion of about 75 km s−1. In addition, we find that systems with an equivalent width below the median – W2796 ≤ 2 Å – show a higher velocity dispersion with 92 km s−1 than the massive ones, hinting that smaller clouds can leave the potential.
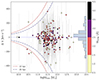 |
Fig. 8. Mg II component velocity centroids with respect to the galaxies’ systemic redshift as a function of the inferred dark matter halo mass. The histogram represents the distribution of the individual component velocities. The dashed and dashed dots show the mass-dependent escape velocities at a distance corresponding to the average and the maximum impact parameters of 10 and 20 kpc, respectively, in our sample. |
5. Discussion and summary
Using the DECaLS imaging and SDSS fibre spectra, we have searched for the galaxies responsible for intervening Mg II absorbers over 0.4 < z < 1.0. We have detected 273 galaxies hosting 270 Mg II absorbers, based on the direct detection of nebular emission lines, at close impact parameters of < 20 kpc around quasars with redshifts ranging from 0.4 to 1. Out of 273 bona fide systems, the host galaxy’s physical properties using multi-band SED fitting were derived for 216 galaxies (213 absorbers). Over the above redshift range, we find that the average detection fraction of Mg II absorber hosts, identified based on strong nebular emission, is 0.005 percent in fibre spectra. These systems preferentially belong to the strong Mg II absorbers with a median W2796 of 2 Å, ranging between 0.27 Å ≤ W2796≤ 4.72 Å. For ultra-strong Mg II absorbers with W2796 ≥ 3 Å, the detection rate of galaxies is factor of ten higher than the absorbers with W2796 ≤ 1 Å. In contrast, in Paper I, we find an exceptionally high detection rate of 40% for ultra-strong Mg II absorbers based on multi-band SED fitting of the deep optical HSC-SSP Subaru and near-infrared VISTA imaging survey. The low detection rate in the present study can be explained by the fact that we only selected the spectroscopically confirmed galaxies based on the direct detection of OII nebular emission, which is affected by fibre loss effects (López & Chen 2012), as well as shallow imaging and relatively poor seeing in the DECaLS survey. In addition, the majority – 84.26% – of systems show a strong Fe II absorption with an W2600/W2796 ratio > 0.5. This is in agreement with the result from Joshi et al. (2018), which indicates that the strong correlation of O [II] luminosity with W2796 and z of Mg II absorbers is mainly driven by such systems.
We find that the W2796 strength as a function of ρ is near constant at small impact parameters of ρ ≤ 20 kpc, which implies a higher gas covering fraction. Guha & Srianand (2024) have found no anti-correlation between the rest equivalent width of various ions, including Ca II, Mn II, Fe II, Mg II, and Mg I, and the impact parameter for 40 Mg II galaxies detected on top of quasars at 0.37 ≤ z ≤ 1.01 and at an impact parameter range of 3–16 kpc. In a high-resolution TNG50 cosmological magnetohydrodynamical simulation of the CGM around star-forming galaxies in 1011.5 − 1012 M⊙ halos at z ≈ 1, for strong Mg II absorber (W2796 > 0.5 Å) systems, DeFelippis et al. (2021) found a constant W2796 out to large impact parameters of ∼50 kpc. For the Mg II systems with an impact parameter greater than R90, largely tracing the disc-halo interface and galaxy halo, we see a strong anti-correlation between W2796 and ρ/Rvir, suggesting that the Mg II gas is linked to the halo mass (see Figure 5).
It is clear from Figure 4 that Mg II absorber host galaxies in our sample, selected based on O [II] nebular emission, follow the main sequence. These galaxies have a typical log(M⋆/M⊙) of 7.94 to 11.11 and SFR of 0.33 to 218.27 M⊙ yr−1, with a median SFR = 5.81 M⊙ yr−1. Interestingly, a select number of dwarf galaxies with log M⋆ < 9.5 M⊙ in our sample show a starburst nature, whereas 10.2% of galaxies show a passive nature with a low average sSFR of log(sSFR) < − 10.6 yr−1. Analyzing 381 star-forming galaxies between 0.70 < z < 2.34 drawn from the MUSE Hubble Ultra Deep Survey, Feltre et al. (2018) have shown that galaxies hosting outflows, seen as having a blue-shifted Mg II absorption signature, preferentially show higher dust and neutral gas content in the interstellar medium. The average M⋆ = 109.89 M⊙ in our Mg II absorber hosts is consistent with the median stellar mass of 1.6 × 10¹⁰ M⊙ of star-forming galaxies hosting outflows.
For Mg II absorbers in our sample, which typically have a strong W2796 of ≳1 Å, we find a mild increasing trend of W2796 with the SFR (see Figure 7). A similar trend is also evidenced with the sSFR. Interestingly, considering only the systems tracing the galaxy halo versus disc-halo interface, with impact parameters greater than R90, the W2796 show a tighter correction with SFR and sSFR with Kendall’s τ = 0.2 (pnull < 0.01) and 0.14 (pnull < 0.01), respectively. In a galaxy-probing-galaxy experiment at a small impact parameter of < 50 kpc, Rubin et al. (2018) found that galaxies with higher stellar masses and SFRs have higher W2796. Lan et al. (2014) analysed the Mg II absorption properties between star-forming and passive galaxies defined by their colours and found an increasing W2796 with M⋆, SFR, and sSFR. In Paper I, we also find a similar trend of W2796 being correlated with the stellar mass and SFR for the ultra-strong Mg II systems (see also, Guha & Srianand 2023). Interestingly, no correction is observed between the W2796 and stellar mass, indicating that the positive correlation between W2796 versus sSFR is driven by the SFR. This is consistent with the observed trend of blue galaxies showing significantly stronger W2796 (Bordoloi et al. 2011; Lan et al. 2014). However, it is worth noting that the galaxy selection in the present study, based on the presence of strong nebular emission, is sensitive to strong W2796 systems, which may influence the W2796 versus M⋆ relation. On the other hand, in the MUSE Analysis of Gas around Galaxies (MAGG) survey of 228 galaxies at z ∼ 0.8 − 1.5 mapping a large-scale environment with an average impact parameter of 165 kpc, Dutta et al. (2020) have found that W2796 strongly correlates with the stellar mass than SFR, but no correlation is seen with the sSFR. The lack of correlation of W2796 with M⋆, and a weak anti-correlation with the impact parameter in our sample, can be attributed to the high gas-covering fraction of about unity for the strong, W2796 > 1Å, systems at the small impact parameter ranges of ≤50 kpc, as is seen in simulations (Ho et al. 2020; Nelson et al. 2020; Ramesh & Nelson 2024) and observations (Zahedy et al. 2019; Dutta et al. 2020; Anand et al. 2021). Using 27 z ≈ 1 host galaxies with W2796 > 0.5 − 0.8 Å in the MusE GAs FLOw and Wind (MEGAFLOW) survey, Schroetter et al. (2024) have shown that the strong outflows show a tighter correlation with the galaxy SFR and stellar mass (see also, Hopkins et al. 2012). Thus, increasing W2796 with the SFR may hint at the origin of Mg II gas in galactic outflows.
We finally find that the Mg II gas is largely bound to the dark matter halo of their host galaxies, except for a few systems. The mean velocity difference of the absorbing gas and galaxy is 78 km s−1, with a dispersion of 75 km s−1. In a cold gas study using the CGM-ZOOM scheme in AREPO, Suresh et al. (2019) have shown that most gas is recycled more than once in galactic fountains. Using the cosmological zoom-in simulation Eris2k, Decataldo et al. (2024) found that outflows make a major contribution to the cold CGM gas budget at z < 1, with almost 50% of the hot gas cooling in the outflow. Tracing this gas physics essentially demands probing the gas at close impact parameters of ≲50 kpc, where gas flows are more pronounced. A follow-up study of galaxies in this sample will enable us to probe the gas accretion and outflows near the disc-halo interface.
Data availability
The Mg II absorber host galaxy catalogue for 216 primary and 57 secondary detection set are available at the CDS via anonymous ftp to cdsarc.cds.unistra.fr (130.79.128.5) or via https://cdsarc.cds.unistra.fr/viz-bin/cat/J/A+A/695/A207.
Acknowledgments
We acknowledge the anonymous referee for the constructive comments. LCH was supported by the National Science Foundation of China (11991052, 12233001), the National Key R&D Program of China (2022YFF0503401), and the China Manned Space Project (CMS-CSST-2021-A04, CMS-CSST-2021-A06). Funding for the Sloan Digital Sky Survey IV has been provided by the Alfred P. Sloan Foundation, the U.S. Department of Energy Office of Science, and the Participating Institutions. SDSS-IV acknowledges support and resources from the Center for High Performance Computing at the University of Utah. The SDSS website is www.sdss4.org. SDSS-IV is managed by the Astrophysical Research Consortium for the Participating Institutions of the SDSS Collaboration including the Brazilian Participation Group, the Carnegie Institution for Science, Carnegie Mellon University, Center for Astrophysics|Harvard & Smithsonian, the Chilean Participation Group, the French Participation Group, Instituto de Astrofísica de Canarias, The Johns Hopkins University, Kavli Institute for the Physics and Mathematics of the Universe (IPMU)/University of Tokyo, the Korean Participation Group, Lawrence Berkeley National Laboratory, Leibniz Institut für Astrophysik Potsdam (AIP), Max-Planck-Institut für Astronomie (MPIA Heidelberg), Max-Planck-Institut für Astrophysik (MPA Garching), Max-Planck-Institut für Extraterrestrische Physik (MPE), National Astronomical Observatories of China, New Mexico State University, New York University, University of Notre Dame, Observatário Nacional/MCTI, The Ohio State University, Pennsylvania State University, Shanghai Astronomical Observatory, United Kingdom Participation Group, Universidad Nacional Autónoma de México, University of Arizona, University of Colorado Boulder, University of Oxford, University of Portsmouth, University of Utah, University of Virginia, University of Washington, University of Wisconsin, Vanderbilt University, and Yale University. The DESI Legacy Imaging Surveys consist of three individual and complementary projects: the Dark Energy Camera Legacy Survey (DECaLS), the Beijing-Arizona Sky Survey (BASS), and the Mayall z-band Legacy Survey (MzLS). DECaLS, BASS and MzLS together include data obtained, respectively, at the Blanco telescope, Cerro Tololo Inter-American Observatory, NSF’s NOIRLab; the Bok telescope, Steward Observatory, University of Arizona; and the Mayall telescope, Kitt Peak National Observatory, NOIRLab. NOIRLab is operated by the Association of Universities for Research in Astronomy (AURA) under a cooperative agreement with the National Science Foundation. Pipeline processing and analyses of the data were supported by NOIRLab and the Lawrence Berkeley National Laboratory (LBNL). Legacy Surveys also uses data products from the Near-Earth Object Wide-field Infrared Survey Explorer (NEOWISE), a project of the Jet Propulsion Laboratory/California Institute of Technology, funded by the National Aeronautics and Space Administration. Legacy Surveys was supported by: the Director, Office of Science, Office of High Energy Physics of the U.S. Department of Energy; the National Energy Research Scientific Computing Center, a DOE Office of Science User Facility; the U.S. National Science Foundation, Division of Astronomical Sciences; the National Astronomical Observatories of China, the Chinese Academy of Sciences and the Chinese National Natural Science Foundation. LBNL is managed by the Regents of the University of California under contract to the U.S. Department of Energy. The complete acknowledgments can be found at https://www.legacysurvey.org/acknowledgment/.
References
- Anand, A., Nelson, D., & Kauffmann, G. 2021, MNRAS, 504, 65 [NASA ADS] [CrossRef] [Google Scholar]
- Anand, A., Kauffmann, G., & Nelson, D. 2022, MNRAS, 513, 3210 [NASA ADS] [CrossRef] [Google Scholar]
- Bacon, R., Brinchmann, J., Conseil, S., et al. 2023, A&A, 670, A4 [NASA ADS] [CrossRef] [EDP Sciences] [Google Scholar]
- Bielby, R., Crighton, N. H. M., Fumagalli, M., et al. 2017, MNRAS, 468, 1373 [CrossRef] [Google Scholar]
- Bolton, A. S., Burles, S., Schlegel, D. J., Eisenstein, D. J., & Brinkmann, J. 2004, AJ, 127, 1860 [NASA ADS] [CrossRef] [Google Scholar]
- Bordoloi, R., Lilly, S. J., Knobel, C., et al. 2011, ApJ, 743, 10 [CrossRef] [Google Scholar]
- Bouché, N., Murphy, M. T., Péroux, C., et al. 2007, ApJ, 669, L5 [CrossRef] [Google Scholar]
- Bouché, N., Hohensee, W., Vargas, R., et al. 2012, MNRAS, 426, 801 [CrossRef] [Google Scholar]
- Calzetti, D., Kinney, A. L., & Storchi-Bergmann, T. 1994, ApJ, 429, 582 [Google Scholar]
- Carnall, A. C., McLure, R. J., Dunlop, J. S., & Davé, R. 2018, MNRAS, 480, 4379 [Google Scholar]
- Chen, H.-W., Helsby, J. E., Gauthier, J.-R., et al. 2010, ApJ, 714, 1521 [NASA ADS] [CrossRef] [Google Scholar]
- Churchill, C. W., Nielsen, N. M., Kacprzak, G. G., & Trujillo-Gomez, S. 2013, ApJ, 763, L42 [NASA ADS] [CrossRef] [Google Scholar]
- Comparat, J., Zhu, G., Gonzalez-Perez, V., et al. 2016, MNRAS, 461, 1076 [NASA ADS] [CrossRef] [Google Scholar]
- Decataldo, D., Shen, S., Mayer, L., Baumschlager, B., & Madau, P. 2024, A&A, 685, A8 [NASA ADS] [CrossRef] [EDP Sciences] [Google Scholar]
- DeFelippis, D., Bouché, N. F., Genel, S., et al. 2021, ApJ, 923, 56 [NASA ADS] [CrossRef] [Google Scholar]
- Dey, A., Schlegel, D. J., Lang, D., et al. 2019, AJ, 157, 168 [Google Scholar]
- Dutta, R., Fumagalli, M., Fossati, M., et al. 2020, MNRAS, 499, 5022 [CrossRef] [Google Scholar]
- Elbaz, D., Leiton, R., Nagar, N., et al. 2018, A&A, 616, A110 [NASA ADS] [CrossRef] [EDP Sciences] [Google Scholar]
- Feltre, A., Bacon, R., Tresse, L., et al. 2018, A&A, 617, A62 [NASA ADS] [CrossRef] [EDP Sciences] [Google Scholar]
- Feroz, F., Hobson, M. P., & Bridges, M. 2009, MNRAS, 398, 1601 [NASA ADS] [CrossRef] [Google Scholar]
- Gauthier, J.-R. 2013, MNRAS, 432, 1444 [NASA ADS] [CrossRef] [Google Scholar]
- Girelli, G., Pozzetti, L., Bolzonella, M., et al. 2020, A&A, 634, A135 [NASA ADS] [CrossRef] [EDP Sciences] [Google Scholar]
- Gordon, K. D., Clayton, G. C., Misselt, K. A., Landolt, A. U., & Wolff, M. J. 2003, ApJ, 594, 279 [NASA ADS] [CrossRef] [Google Scholar]
- Guha, L. K., & Srianand, R. 2023, MNRAS, 519, 3319 [NASA ADS] [CrossRef] [Google Scholar]
- Guha, L. K., & Srianand, R. 2024, MNRAS, 532, 3056 [Google Scholar]
- Guha, L. K., Srianand, R., Dutta, R., et al. 2022, MNRAS, 513, 3836 [NASA ADS] [CrossRef] [Google Scholar]
- Guha, L. K., Srianand, R., & Petitjean, P. 2024, MNRAS, 527, 5075 [Google Scholar]
- Guo, Y., Bacon, R., Bouché, N. F., et al. 2023, Nature, 624, 53 [NASA ADS] [CrossRef] [Google Scholar]
- Ho, S. H., Martin, C. L., & Schaye, J. 2020, ApJ, 904, 76 [NASA ADS] [CrossRef] [Google Scholar]
- Ho, S. H., Martin, C. L., & Schaye, J. 2021, ApJ, 923, 137 [NASA ADS] [CrossRef] [Google Scholar]
- Hopkins, P. F., Quataert, E., & Murray, N. 2012, MNRAS, 421, 3522 [Google Scholar]
- Ichikawa, T., Kajisawa, M., & Akhlaghi, M. 2012, MNRAS, 422, 1014 [NASA ADS] [CrossRef] [Google Scholar]
- Joshi, R., Srianand, R., Noterdaeme, P., & Petitjean, P. 2017a, MNRAS, 465, 701 [CrossRef] [Google Scholar]
- Joshi, R., Srianand, R., Petitjean, P., & Noterdaeme, P. 2017b, MNRAS, 471, 1910 [Google Scholar]
- Joshi, R., Srianand, R., Petitjean, P., & Noterdaeme, P. 2018, MNRAS, 476, 210 [NASA ADS] [CrossRef] [Google Scholar]
- Kacprzak, G. G., Murphy, M. T., & Churchill, C. W. 2010, MNRAS, 406, 445 [NASA ADS] [CrossRef] [Google Scholar]
- Kacprzak, G. G., Churchill, C. W., Barton, E. J., & Cooke, J. 2011, ApJ, 733, 105 [NASA ADS] [CrossRef] [Google Scholar]
- Kacprzak, G. G., Martin, C. L., Bouché, N., et al. 2014, ApJ, 792, L12 [NASA ADS] [CrossRef] [Google Scholar]
- Kennicutt, R. C. 1998, ApJ, 498, 541 [NASA ADS] [CrossRef] [Google Scholar]
- Lan, T.-W., & Mo, H. 2018, ApJ, 866, 36 [NASA ADS] [CrossRef] [Google Scholar]
- Lan, T.-W., Ménard, B., & Zhu, G. 2014, ApJ, 795, 31 [NASA ADS] [CrossRef] [Google Scholar]
- Lang, D., Hogg, D. W., & Schlegel, D. J. 2016, AJ, 151, 36 [Google Scholar]
- López, G., & Chen, H.-W. 2012, MNRAS, 419, 3553 [CrossRef] [Google Scholar]
- Lopez, S., Tejos, N., Barrientos, L. F., et al. 2020, MNRAS, 491, 4442 [NASA ADS] [CrossRef] [Google Scholar]
- Lundgren, B. F., Brammer, G., van Dokkum, P., et al. 2012, ApJ, 760, 49 [NASA ADS] [CrossRef] [Google Scholar]
- Lundgren, B. F., Creech, S., Brammer, G., et al. 2021, ApJ, 913, 50 [NASA ADS] [CrossRef] [Google Scholar]
- Murphy, M. T., & Liske, J. 2004, MNRAS, 354, L31 [Google Scholar]
- Murray, N., Ménard, B., & Thompson, T. A. 2011, ApJ, 735, 66 [NASA ADS] [CrossRef] [Google Scholar]
- Nateghi, H., Kacprzak, G. G., Nielsen, N. M., et al. 2024, MNRAS, 534, 930 [NASA ADS] [CrossRef] [Google Scholar]
- Navarro, J. F., Frenk, C. S., & White, S. D. M. 1996, ApJ, 462, 563 [Google Scholar]
- Nelson, D., Sharma, P., Pillepich, A., et al. 2020, MNRAS, 498, 2391 [NASA ADS] [CrossRef] [Google Scholar]
- Nestor, D. B., Johnson, B. D., Wild, V., et al. 2011, MNRAS, 412, 1559 [NASA ADS] [CrossRef] [Google Scholar]
- Nielsen, N. M., Churchill, C. W., & Kacprzak, G. G. 2013, ApJ, 776, 115 [NASA ADS] [CrossRef] [Google Scholar]
- Noterdaeme, P., Srianand, R., & Mohan, V. 2010, MNRAS, 403, 906 [NASA ADS] [CrossRef] [Google Scholar]
- Péroux, C., Rahmani, H., Quiret, S., et al. 2017, MNRAS, 464, 2053 [CrossRef] [Google Scholar]
- Péroux, C., Zwaan, M. A., Klitsch, A., et al. 2019, MNRAS, 485, 1595 [CrossRef] [Google Scholar]
- Péroux, C., Nelson, D., van de Voort, F., et al. 2020, MNRAS, 499, 2462 [CrossRef] [Google Scholar]
- Popesso, P., Concas, A., Cresci, G., et al. 2023, MNRAS, 519, 1526 [Google Scholar]
- Rahmati, A., Schaye, J., Bower, R. G., et al. 2015, MNRAS, 452, 2034 [CrossRef] [Google Scholar]
- Ramesh, R., & Nelson, D. 2024, MNRAS, 528, 3320 [NASA ADS] [CrossRef] [Google Scholar]
- Rao, S. M., Turnshek, D. A., & Nestor, D. B. 2006, ApJ, 636, 610 [Google Scholar]
- Rubin, K. H. R., Diamond-Stanic, A. M., Coil, A. L., Crighton, N. H. M., & Moustakas, J. 2018, ApJ, 853, 95 [NASA ADS] [CrossRef] [Google Scholar]
- Schroetter, I., Bouché, N. F., Zabl, J., et al. 2024, A&A, 687, A39 [NASA ADS] [CrossRef] [EDP Sciences] [Google Scholar]
- Srianand, R., Gupta, N., Petitjean, P., Noterdaeme, P., & Saikia, D. J. 2008, MNRAS, 391, L69 [NASA ADS] [Google Scholar]
- Straka, L. A., Noterdaeme, P., Srianand, R., et al. 2015, MNRAS, 447, 3856 [Google Scholar]
- Suresh, J., Nelson, D., Genel, S., Rubin, K. H. R., & Hernquist, L. 2019, MNRAS, 483, 4040 [NASA ADS] [CrossRef] [Google Scholar]
- Tumlinson, J., Peeples, M. S., & Werk, J. K. 2017, ARA&A, 55, 389 [Google Scholar]
- Weng, S., Péroux, C., Ramesh, R., et al. 2024, MNRAS, 527, 3494 [Google Scholar]
- Zabl, J., Bouché, N. F., Schroetter, I., et al. 2019, MNRAS, 485, 1961 [NASA ADS] [CrossRef] [Google Scholar]
- Zabl, J., Bouché, N. F., Wisotzki, L., et al. 2021, MNRAS, 507, 4294 [NASA ADS] [CrossRef] [Google Scholar]
- Zahedy, F. S., Chen, H.-W., Gauthier, J.-R., & Rauch, M. 2017, MNRAS, 466, 1071 [Google Scholar]
- Zahedy, F. S., Chen, H.-W., Johnson, S. D., et al. 2019, MNRAS, 484, 2257 [NASA ADS] [CrossRef] [Google Scholar]
- Zhu, G., & Ménard, B. 2013, ApJ, 770, 130 [NASA ADS] [CrossRef] [Google Scholar]
- Zibetti, S., Ménard, B., Nestor, D. B., et al. 2007, ApJ, 658, 161 [NASA ADS] [CrossRef] [Google Scholar]
All Figures
|
Fig. 1. Postage stamp DECaLS colour composite images, centred on the quasar. The SDSS fibre, with a radius of 1.5″, is indicated by dashed circles, while the cyan-coloured aperture highlights the MgII host galaxy. The second column exhibits the multi-band SED fit at the absorber redshift. Columns three and four show the detected [O II] λλ3727,3729 and [O III] λ5008 nebular emission line from the Mg II absorber host, respectively. |
| In the text | |
|
Fig. 2. An example highlighting the advantage of using deep-imaging and strong nebular emission line-based search to avoid false positive detections. Left panel: Multi-band colour composite image centred on quasar J152555.82+010835.5. The quasar and absorber host galaxy candidates detected in the DECaLS survey within 2 arcsec are marked as star and cross symbols. In addition, the dashed and solid circle shows the SDSS fibre of radius 1.5 arcsec and absorber candidate. The contour represents the best-fit model for the quasar and the galaxy provided by DECaLS. Right upper panels: Residual g, r, i, z passband images. The cross symbol shows an additional stellar counterpart not detected by DECaLS, but detected in the residual images of all the passbands, which is likely the potential host. Lower panels: SED fit at the absorber redshift of zabs = 0.39 along with the [O II] λλ3727,3729 and [O III] λ5008 nebular emission. |
| In the text | |
|
Fig. 3. Detection probability of Mg II absorbers. Left panel: Detection fraction as a function of redshift. The average DECaLS rmag of galaxies per redshift bin is shown as a square, along with the 16th and 84th percentiles. Right panel: Equivalent width (W2796) distribution of Mg II absorbers for entire sample with z < 1 (solid histogram). The hatched histogram shows the distribution for the detection set, given in the right-hand-side ordinates. The detection fraction per W2796 bin is shown as a square symbol given in the additional y axis, the right-hand-side ordinates. |
| In the text | |
|
Fig. 4. Star formation main sequence relation for MgII absorber host galaxies. The symbols are colour-coded with a specific SFR. The shaded and hatched regions indicate the 1σ confidence interval. Additionally, the dotted line represents the SFR threshold for wind launching from Murray et al. (2011). Top panel: SFR of Mg II galaxies normalized by the main sequence star-forming galaxy at the respective redshift. |
| In the text | |
|
Fig. 5. Radial dependence of Mg II absorption strength. Left panel: Mg II absorber rest-frame equivalent width versus impact parameter along with the best fit shown as a hatched region. The W2796-vs-ρ best-fit relation from Guha et al. (2022) is shown as a shaded region. Right panel: Mg II absorber equivalent width versus impact parameter normalized by the galaxy’s virial radius (ρ/Rvir). The best-fit relation from Churchill et al. (2013) is shown as a hatched region. The galaxies with impact pentameters below R90 radii are shown as squares. The symbols are colour-coded with stellar mass. |
| In the text | |
|
Fig. 6. Rest-frame equivalent width ratio between Fe IIλ2600 and Mg IIλ2796 absorption versus impact parameter normalized by the galaxy’s virial radius (ρ/Rvir). The symbols are colour-coded with specific SFRs. |
| In the text | |
|
Fig. 7. Distribution of Mg II equivalent width with the galaxy stellar mass, SFR, and specific SFR. The square symbols represent the median values over three equal bins. |
| In the text | |
|
Fig. 8. Mg II component velocity centroids with respect to the galaxies’ systemic redshift as a function of the inferred dark matter halo mass. The histogram represents the distribution of the individual component velocities. The dashed and dashed dots show the mass-dependent escape velocities at a distance corresponding to the average and the maximum impact parameters of 10 and 20 kpc, respectively, in our sample. |
| In the text | |
Current usage metrics show cumulative count of Article Views (full-text article views including HTML views, PDF and ePub downloads, according to the available data) and Abstracts Views on Vision4Press platform.
Data correspond to usage on the plateform after 2015. The current usage metrics is available 48-96 hours after online publication and is updated daily on week days.
Initial download of the metrics may take a while.