Fig. 3.
Download original image
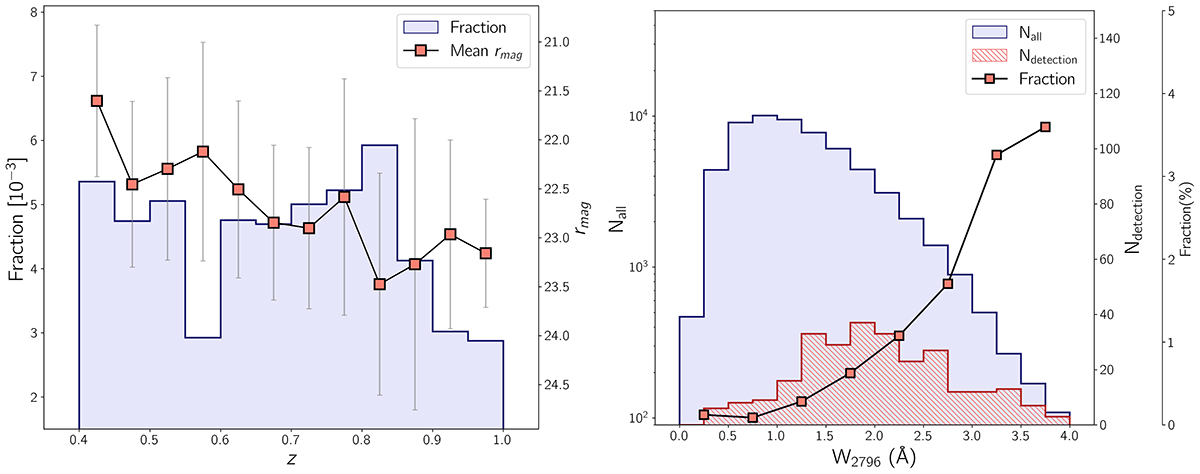
Detection probability of Mg II absorbers. Left panel: Detection fraction as a function of redshift. The average DECaLS rmag of galaxies per redshift bin is shown as a square, along with the 16th and 84th percentiles. Right panel: Equivalent width (W2796) distribution of Mg II absorbers for entire sample with z < 1 (solid histogram). The hatched histogram shows the distribution for the detection set, given in the right-hand-side ordinates. The detection fraction per W2796 bin is shown as a square symbol given in the additional y axis, the right-hand-side ordinates.
Current usage metrics show cumulative count of Article Views (full-text article views including HTML views, PDF and ePub downloads, according to the available data) and Abstracts Views on Vision4Press platform.
Data correspond to usage on the plateform after 2015. The current usage metrics is available 48-96 hours after online publication and is updated daily on week days.
Initial download of the metrics may take a while.